
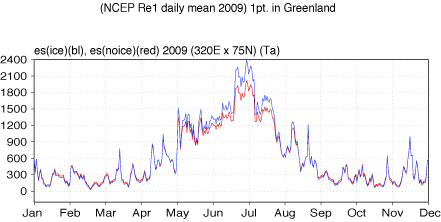
top) es vs. rel. hum. computed over Ice and No Ice plotted individually over timeseries
bottom)same but with IceNoIce mask
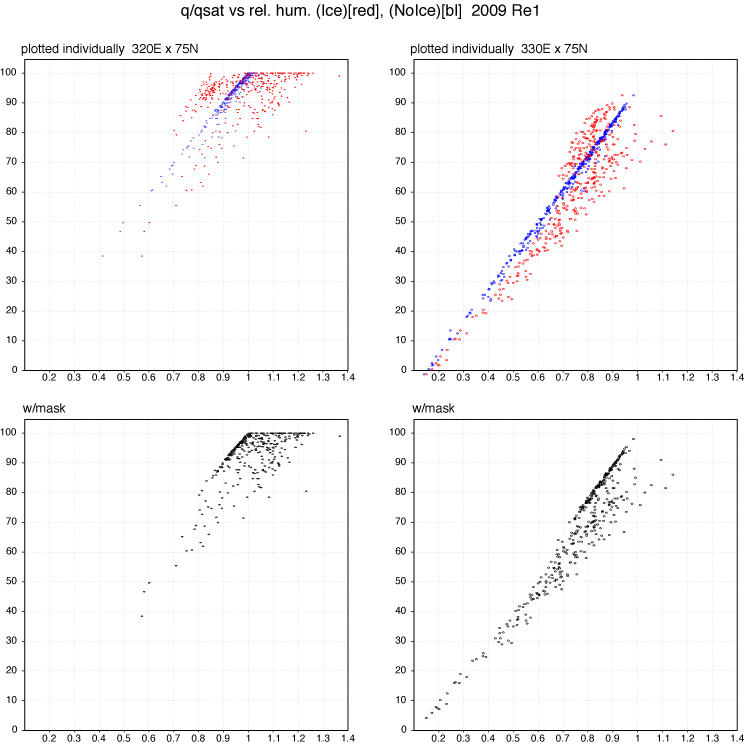
top) q/qsat vs. Ta computed over Ice and No Ice plotted individually over timeseries
bottom)same but with IceNoIce mask
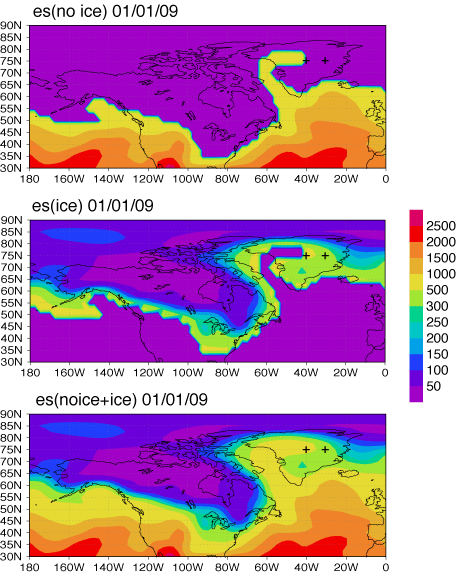
a) es with No Ice mask
b) es with Ice mask
c) es with IceNoIce combined
es for Ice and NoIce calculations
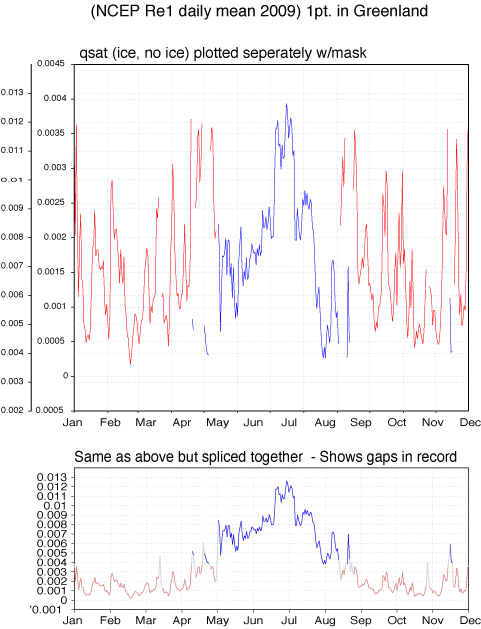
a) qsat plotted with Ice calculation mask only and No Ice calc. mask
b) same as above only spliced together (with qsat as it appears when Ice and NoIce are added before plotting (Gray)).
Note: There are gaps in the data.
left panel at edge of IceNoIce mask(320E x 75N), right panel (330E x 75N)
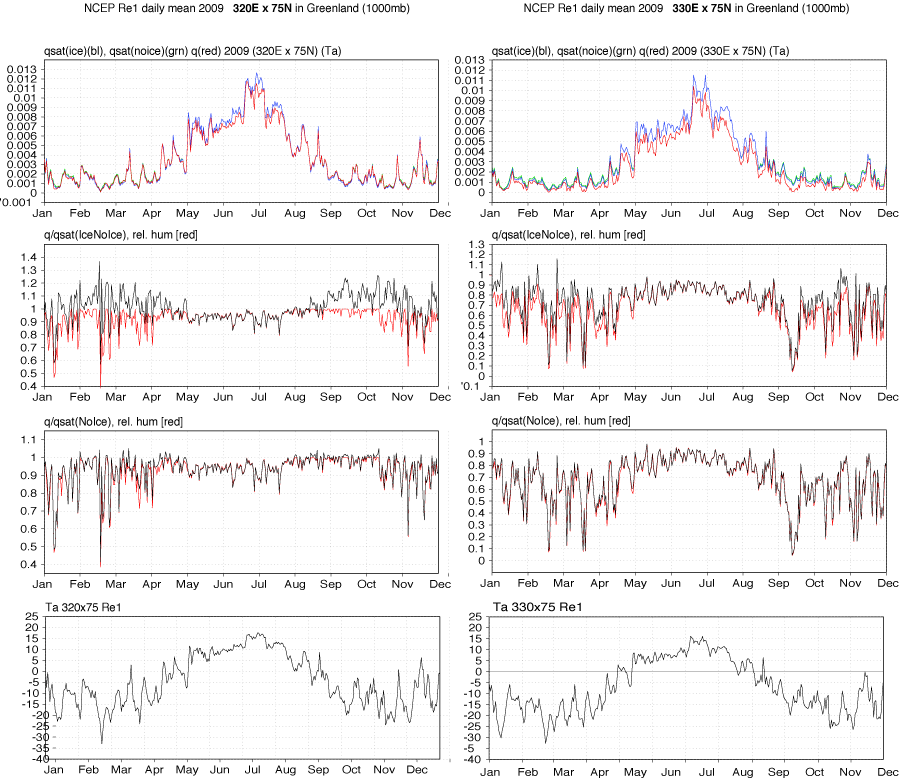
a) qsat computed over Ice and No Ice and q overlaid on top of each other
b) q/qsat with IceNoIce mask calculation and rel. hum.
c) q/qsat with No Ice calculation and rel. hum.
d) 2m Temp.
Thought maybe the problem might be with mask and but the right panel which is further from the mask boundary is still off wrt rel. hum. over ice.
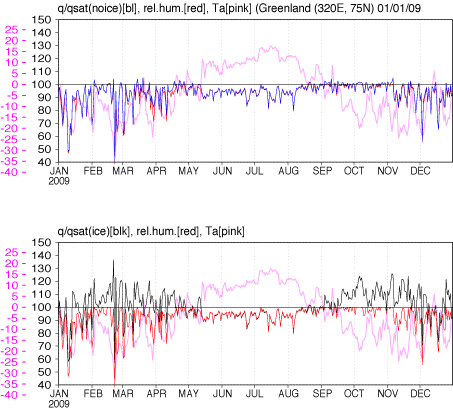
q/qsat(for NoIce and IceNoIce calc's), Rel. Hum., and Ta
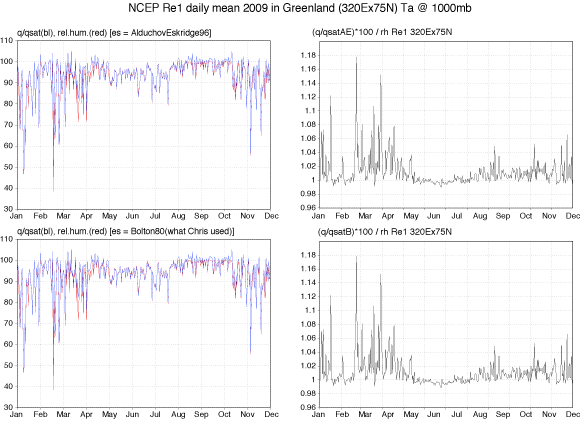
q/qsat, rel. hum. calculated with Chris's (Bolton, 1980) calculation for es and newer AlduchovEskridge, 1996 calculation.
These are almost identical (No Ice used in qsat calc) 'define es(Bolton80) = (6.112*exp(17.67*(Ta-273.15)/(243.5 + (Ta-273.15))))*100' 'define es(AlduchovEskridge96) = (6.1094*exp(17.625*(Ta-273.15)/(243.04 + (Ta-273.15))))*100'
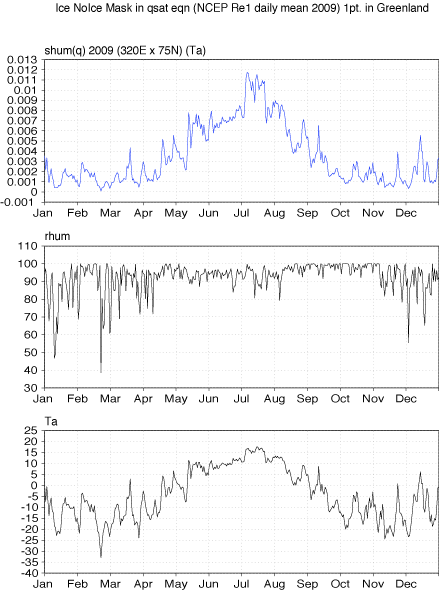
Specific humidity, Relative humidity and 2m Air temperature