|
||||||||||||||||
|

Climate Feedbacks September sea-ice cover in the Arctic Ocean projected to vanish by 2100 The
Arctic climate is changing rapidly. From 1979 to 2006,
September sea-ice extent decreased by
almost 25% or about
100,000 km2
per year. In September 2007,
Arctic sea-ice extent reached its lowest
level since satellite observations
began and in
September 2008, sea-ice cover was
still low. This development has raised concerns that
the Arctic Ocean could be ice-free in late
summer in only a
few decades, with important economic and geopolitical
implications. Unfortunately, most current
climate models
significantly underestimate the observed
trend in Arctic sea-ice
decline, leading to doubts regarding their projections
for the timing of ice-free conditions. In
this paper, we analyze the simulated
trends in past sea-ice cover in 18 state-of-art-climate
models and find a direct relationship
between the simulated evolution
of September sea-ice extent over the twenty-first
century and the magnitude of past trends
in sea-ice cover (Figure 1). The
reason for this consistently strong relationship is that
simulated trends
and future changes in September sea ice extent are both
determined to a large
extent by the baseline sea-ice thickness distribution. This
parameter controls most of the intermodel
variations in recent trends
and continues to have an important role in the evolution
of the sea ice extent throughout the
twenty-first century period. Using
the relationship between simulated trends and future changes
together with observed trends, we project
the evolution of September sea-ice cover over the
twenty-first
century. We find that under a scenario with
medium future greenhouse-gas emissions,
the Arctic Ocean will
probably be ice-free in September before the end of the
twenty-first century.
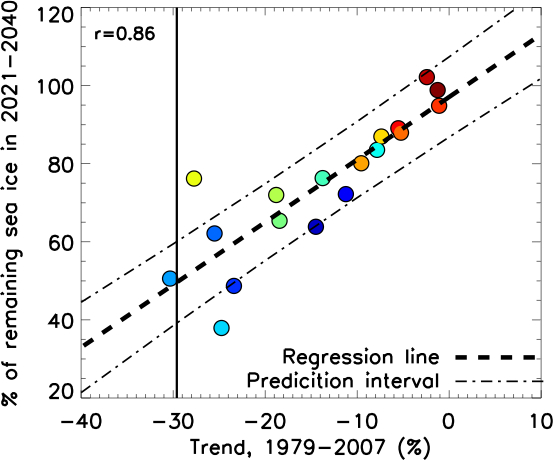
Fig
1. Mean simulated percentage
of remaining sea ice in September in the 2021¨C2040 period
as a function of the trend in the
1979¨C2007 period. Each point corresponds
to a CMIP3 model. The vertical bar
denotes the
observed trend. The 68% confidence prediction interval is
estimated using
the linear regression model. Download the publication (Bo¨¦ et. al. 2009) describing these results in more detail.
|
|||||||||||||||