|
||||||||||||||||
|

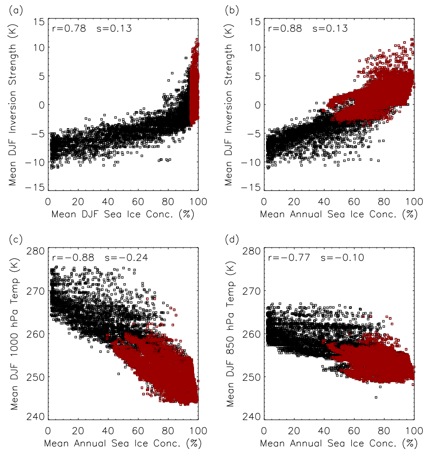
Climate Feedbacks Atmospheric inversion strength over polar oceans in winter regulated by sea ice Low-level temperature inversions are a common feature of the wintertime troposphere in the Arctic and Antarctic. Inversion strength plays an important role in regulating atmospheric processes including air pollution, ozone destruction, cloud formation, and negative longwave feedback mechanisms that shape polar climate response to anthropogenic forcing as shown in Bo¨¦ et al. (2009). It is therefore important to better understand what controls the Arctic atmosphere's vertical temperature structure. In this paper, we examine the influence of sea ice concentration on inversion strength in the Arctic and Antarctic using satellite observations. First, we verify that the Atmospheric Infrared Sounder (AIRS) instrument provides reliable measures of spatial patterns in mean wintertime inversion strength when compared with available radiosonde observations and reanalysis products. Then, we show that a strong spatial correlation exists between inversion strength and mean annual sea ice concentration, likely a surrogate for the effective thermal conductivity of the wintertime ice pack (Figure 1b). We find a substantially stronger linear relationship between sea ice concentration and near-surface air temperature than with temperature at 850 hPa, lending credence to the idea that sea ice controls inversion strength through modulation of surface heat fluxes (Figure 1c and 1d). As such, declines in sea ice in either hemisphere may imply weaker mean inversions in the future. Comparison of mean inversion strength in AIRS and global climate models suggests that many climate models poorly simulate present-day mean inversion strength at high latitudes, which is expected to influence their response to anthropogenic forcing.
Figure1. Scatterplots for Arctic north of 64N between (a) mean AIRS DJF inversion strength and mean DJF sea ice concentration (SIC) from SSMI, (b) mean AIRS DJF inversion strength and mean annual SIC, (c) mean AIRS DJF 1,000 hPa temperature and mean annual SIC, and (d) mean AIRS DJF 850 hPa temperature and mean annual SIC. Points in red are those points with DJF SIC [90%, which show little covariance with inversions strength in (a) but are strongly correlated with inversion strength in (b) and (c). All correlation coefficients are statistically significant at p < 0.01. Download the publication (Pavelsky et. al. 2011) describing these results in more detail.
|
|
||||||||||||||