|
||||||||||||||||
|

Regional Climate Dynamics Observed changes in the Sierra Nevada snowpack: potential causes and concerns A
study of the California Sierra Nevada snowpack has been
conducted using snow station observations and observed
surface temperature data. Monthly snow water equivalent
("SWE") measurements were combined from two data sets to
provide sufficient data for statistical analysis from 1930
to 2008. The monthly snapshots are used to calculate peak
snow mass timing for each snow season. Since 1930, there has
been an overall California trend towards earlier snow mass
peak timing by 0.6 days per decade. The trend towards
earlier timing also occurs at nearly all individual
stations. Even stations showing an increase in late season
snowpack values (April 1st SWE) exhibit the trend toward
earlier timing, indicating that enhanced melting is
occurring at nearly all stations even when more snow is
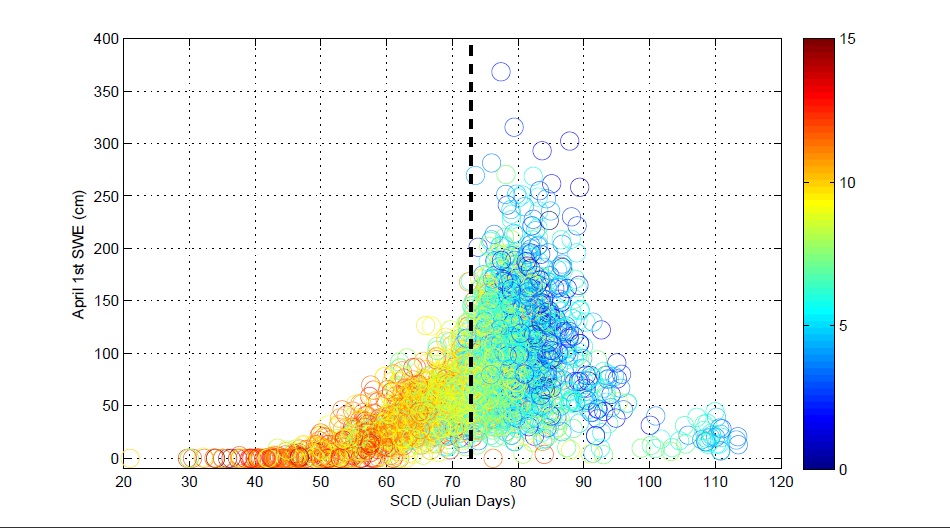
accumulating during the season. Analysis of individual years
and stations reveals that warm daily maximum temperatures
averaged over March and April are associated with earlier
snow mass peak timing for all spatial and temporal scales
included in the data set (see
accompanying figure).
The influence is particularly pronounced for low
accumulation years indicating the potential importance of
albedo feedback for the melting of shallow snow. The
robustness of the early spring temperature influence on peak
timing suggests the trend towards earlier peak timing is
attributable to the simultaneous warming trend (0.1 degrees
Celsius per decade since 1930, with an acceleration in
warming in later time periods). Given future scenarios of
warming in California, we can expect acceleration in the
trend towards earlier peak timing; this will reduce the warm
season storage capacity of the California snowpack. Download the paper (Kapnick et. al. 2009) describing these results in more detail. |
|||||||||||||||