 |
 |
 |
 |
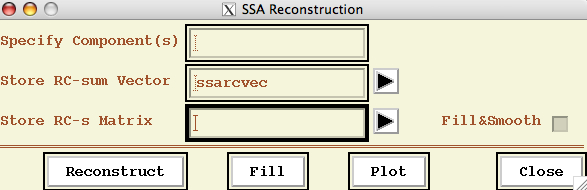
A novel, iterative form of SSA is used to analyze datasets with uneven sampling or missing observations. Gaps are filled-in by utilizing spatio-temporal correlations in the dataset. File data with "NaN" values are treated as missing. Gap-filling feature is available in Reconstruction option of SSA (MSSA) panel, for univariate (multivariate) data, respectively.
The user needs to select the data pop-up menu of SSA (MSSA) tool, specify the SSA (MSSA) window size (large enough to cover longest temporal correlations; for a guidance it can be the largest period in the dataset), the number of SSA (MSSA) components on the main(!) SSA (MSSA) panel, and the method for estimating the covariance matrix that is decomposed (diagonalized) by SSA (MSSA). Then gap-filling can be done just by clicking Fill. The number of SSA (MSSA) components one has to use depends on the dataset, and in particular on the amount of noise present. The main idea is to discard higher-ranked components corresponding to noise, and use only "smooth" components of "signal". When Fill&Smooth box is checked, then the result will be equal to estimated smooth component everywhere, i.e. both points where the ortiginal data is missing and available. Otherwise, original data is retained in the points where data is available. By clicking Plot, user can compare the gappy and filled-in dataset.
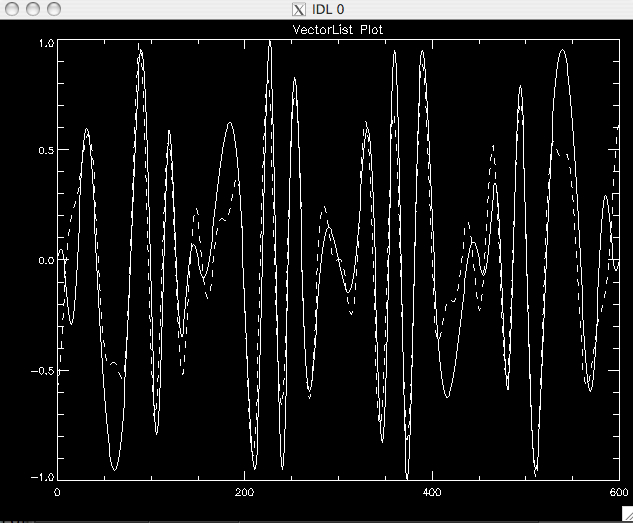
First, we demonstrate gap filling on univariate synthetic time series. It is 600 data points long, and consists of the oscillatory carrier signal with a period of T=40 units (data0). This oscillation is modulated in phase with period of T=120, and in amplitude with period of T=200; it is also contaminated by large amplitude white noise (fulldata). Two gappy data sets have large continuous gaps in different locations (data1 and data2). Figures below show the estimated smooth component ( Fill&Smooth box is checked) corresponding to the small (6) number of SSA components that contain the oscillatory signal only; SSA window is equal to 200.
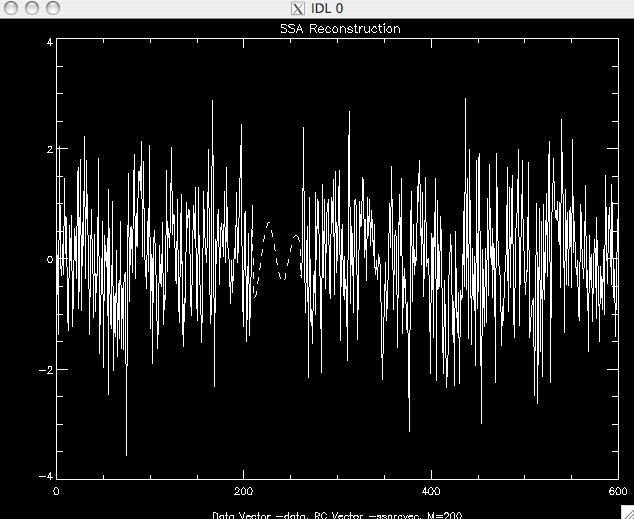
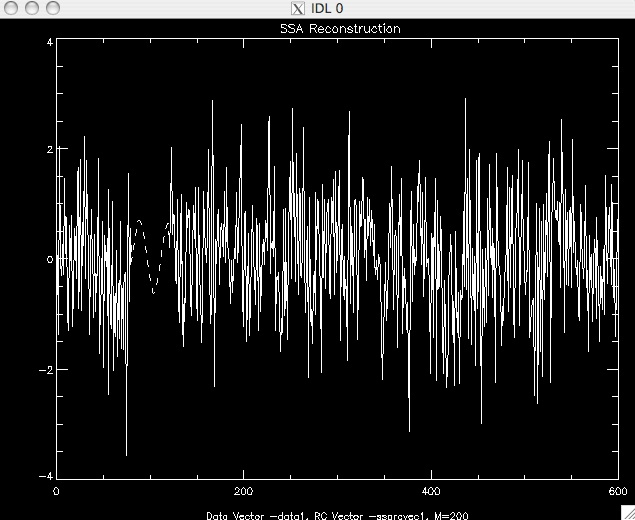
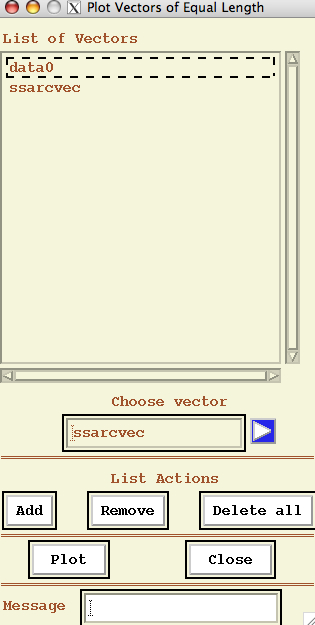
When number of components is increased, the reconstruction in gaps will involve noise, which can be useful for some applications. To compare with the full smooth component (data0), user can use the Plot/Vector List option: