Prediction of Arctic Sea Ice Extent
Decline in the Arctic sea ice extent (SIE) has profound socio-economic implications and is a focus of active scientific research. Of particular interest is prediction of SIE on subseasonal time scales, i.e.~from early summer into fall, when sea ice coverage in Arctic reaches its minimum. However, subseasonal forecasting of SIE is very challenging due to the high variability of ocean and atmosphere over Arctic in summer, as well as shortness of observational data and inadequacies of the physics-based models to simulate sea-ice dynamics. The Sea Ice Outlook (SIO) by Sea Ice Prediction Network (SIPN) is a collaborative effort to facilitate subseasonal prediction of September SIE by physics-based and statistical models.
Data-adaptive Harmonic Decomposition (DAHD) and ML stochastic modeling techniques [Kondrashov et al. 2018] have been shown successful for retrospective and real-time summertime regional forecasting of Arctic Sea Ice extent.
The real-time DAHD prediction of September SIE was fairly accurate and very competitive among statistical and physics-based models in 2016, 2017, 2018, 2019, 2020, 2021, 2022,
Sea Ice Outlook (SIO) submissions. The average of DAHD-based summertime Outlooks (June, July, August, September) was within ~0.3 Mkm2 of the observed September pan-Arctic SIE for seven years in a row, given a total SIE area of ~5.0 Mkm2 and inter-quartile range spread of ~0.5 Mkm2:
2016: 4.90 (predicted) vs 4.70 (observed) million km2
2017: 4.57 (predicted) vs 4.80 (observed) million km2
2018: 4.53 (predicted) vs 4.71 (observed) million km2
2019: 4.42 (predicted) vs 4.32 (observed) million km2
2020: 4.40 (predicted) vs 3.92 (observed) million km2
2021: 4.59 (predicted) vs 4.90 (observed) million km2
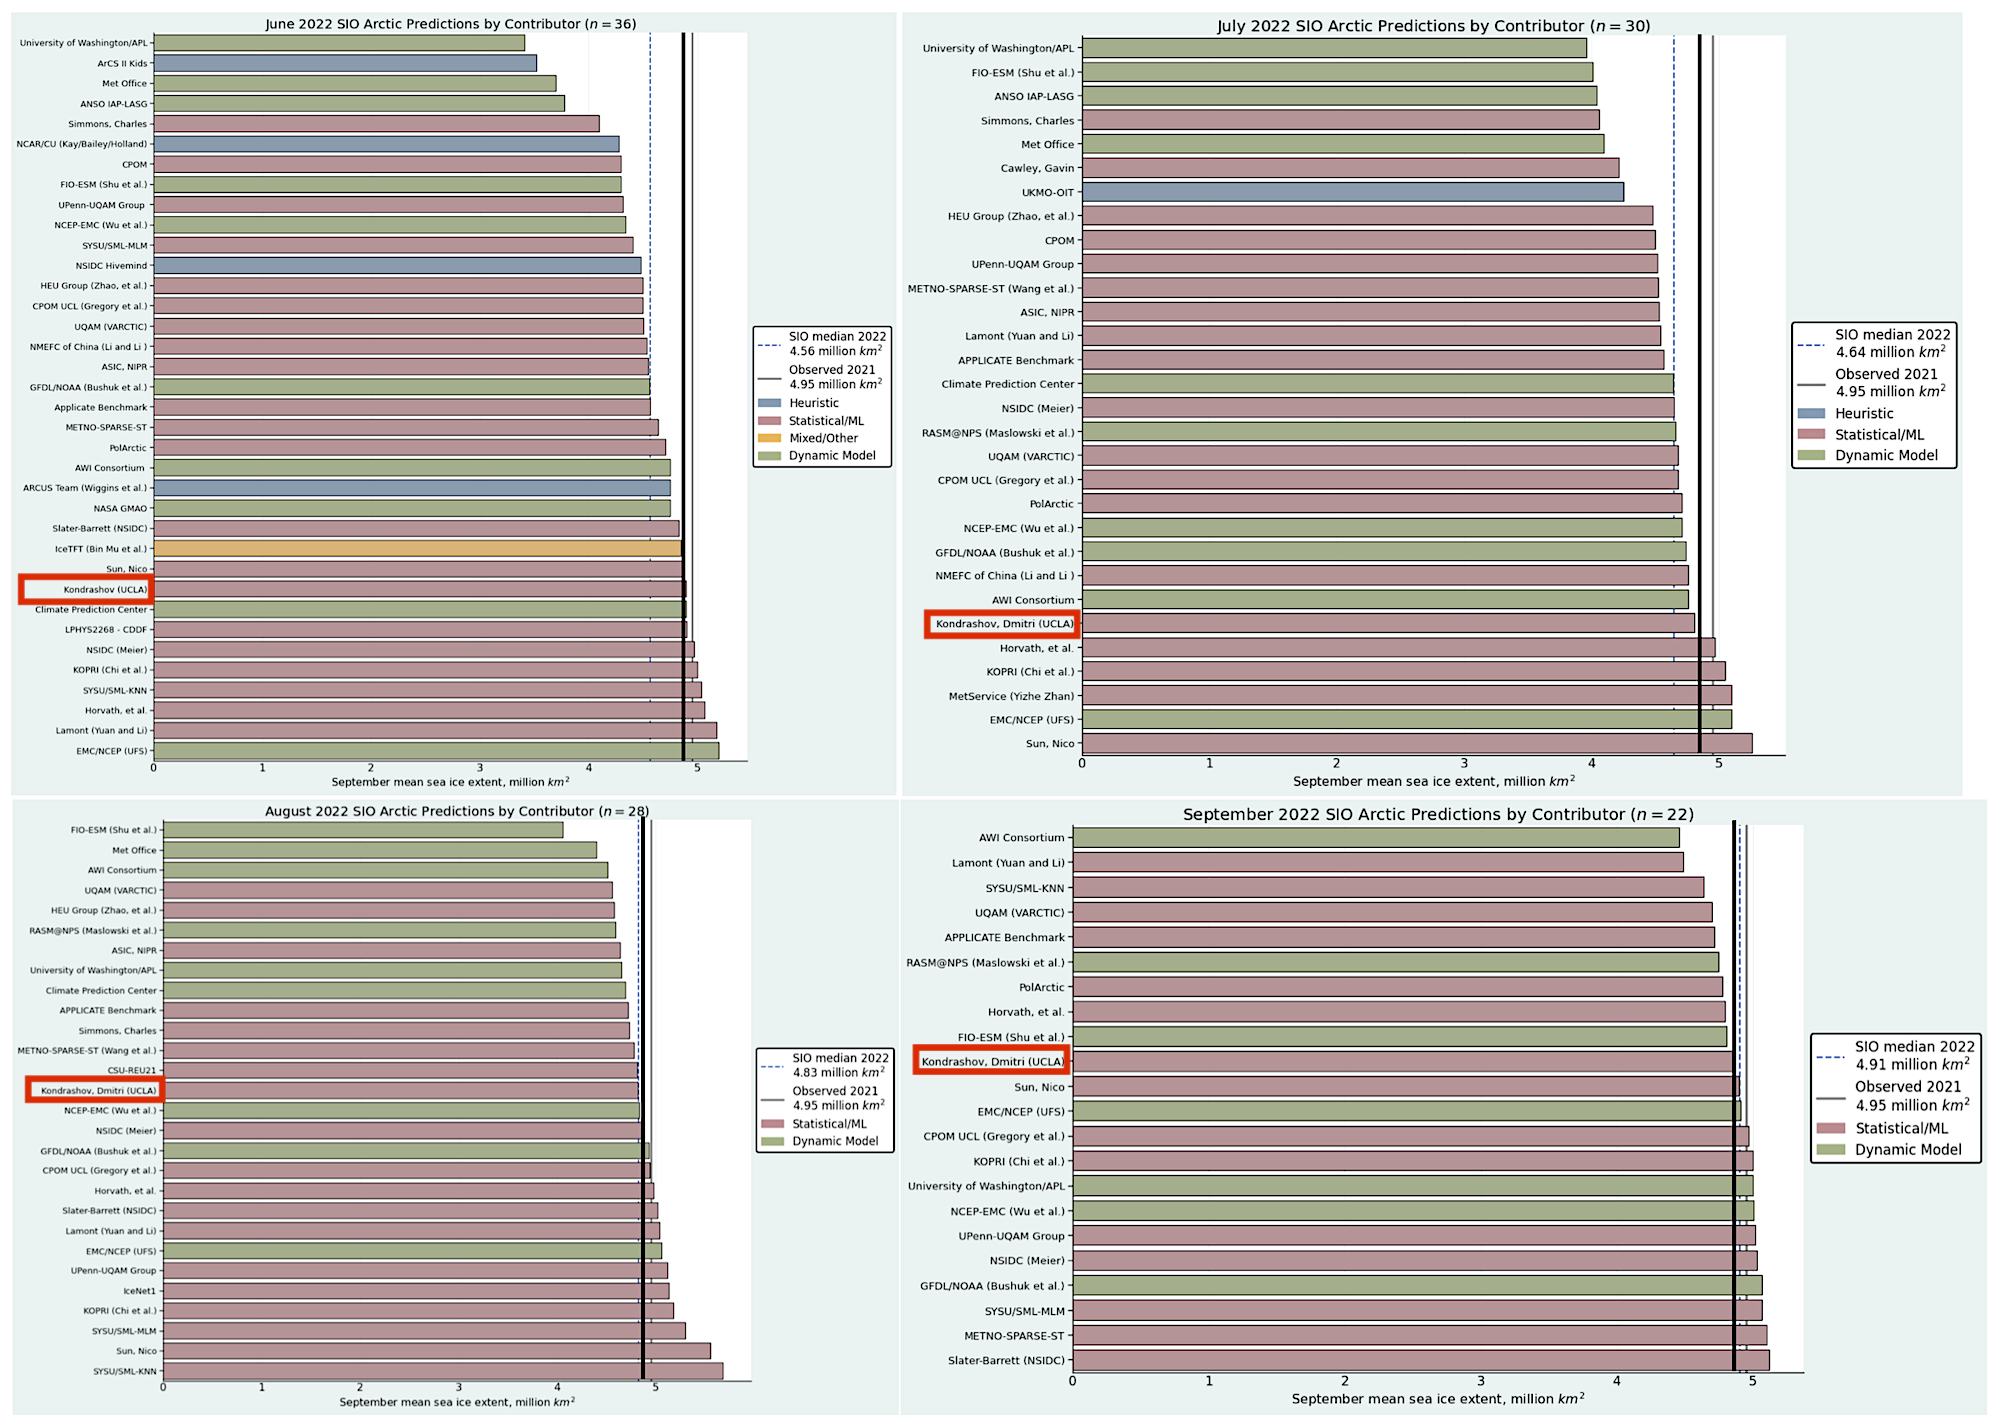
2022: 4.85 (predicted) vs 4.87 (observed) million km2
The key factors to this success are associated with DAHD/ML capability to disentangle complex regional dynamics of Arctic Sea ice by data-adaptive harmonic spatio-temporal patterns.
References
-
1.Kondrashov, D., M. D. Chekroun, and M. Ghil, 2018:
Data-adaptive harmonic decomposition and prediction of Arctic sea ice extent,
Dynamics and Statistics of the Climate System, 3(1), doi:10.1093/climsys/dzy001.
-
2.Kondrashov, D., M. D. Chekroun, X. Yuan, and M. Ghil, 2018:
Data-adaptive Harmonic Decomposition and Stochastic Modeling of Arctic Sea Ice,
in: Tsonis A. (eds) Advances in Nonlinear Geosciences. Springer, doi:10.1007/978-3-319-58895-7_10.
Springer Nature 2019 Highlight in Earth Sciences (Book Chapters)
-
3.Chekroun, M. D., and D. Kondrashov, 2017:
Data-adaptive harmonic spectra and multilayer Stuart-Landau models,
Chaos, 27, 093110: doi:10.1063/1.4989400, HAL preprint.
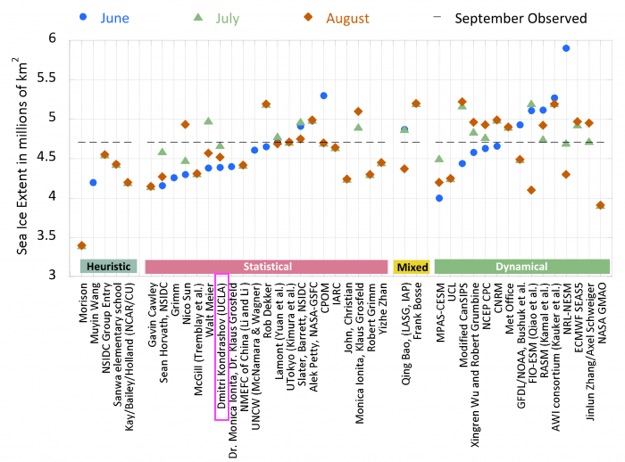
2018 Outlook contributions by group for June (blue dot), July (green triangle), and August (orange diamond) are organized by general type of method; DAHD is marked by red box among statistical methods.
The 2018 observed September SIE minimum is shown by dotted grey line,
adapted from https://www.arcus.org/sipn/sea-ice-outlook/2018/post-season.
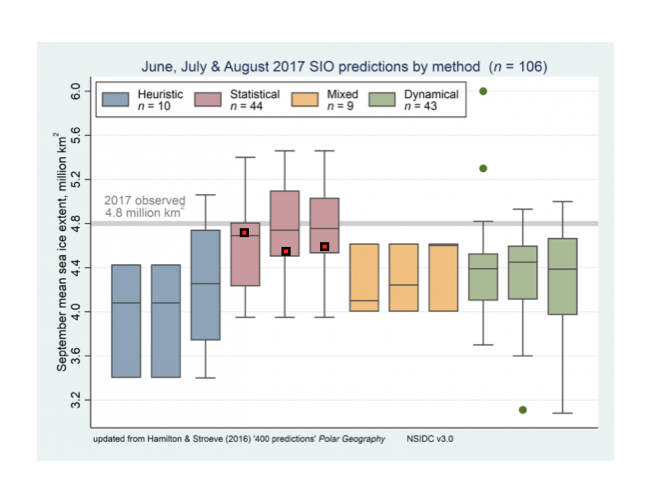
Predictions of the Arctic SIE in the Sea Ice Outlook (SIO) for 2017; the red square marks DAHD prediction of September SIE. Contributions as box plots, broken down by type of method. Boxes show medians and interquartile ranges. Colors identify method types, and n denotes the number of contributions. Individual boxes for each method represent, from left to right, contributions to the June, July, and August SIO. The heavy gray line shows the 2017 observed September SIE from the NSIDC index, from https://www.arcus.org/sipn/sea-ice-outlook/2017/post-season.
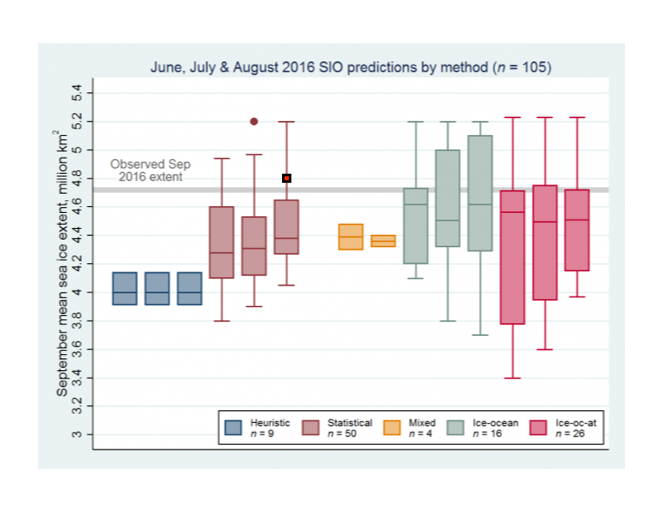
Predictions of the Arctic SIE in the Sea Ice Outlook (SIO) for 2016; the red square marks DAHD prediction of September SIE. Contributions as box plots, broken down by type of method. Boxes show medians and interquartile ranges. Colors identify method types, and n denotes the number of contributions. Individual boxes for each method represent, from left to right, contributions to the June, July, and August SIO. The heavy gray line shows the 2016 observed September SIE from the NSIDC index, from https://www.arcus.org/sipn/sea-ice-outlook/2016/post-season.
2022 Outlook Contributions. The vertical black line is the observed value, and DAHD model forecast is marked by red box. Adapted from Fig. 9 at https://www.arcus.org/sipn/sea-ice-outlook/2022/post-season