 [3]
[3]Among these tools is a program to perform windowed fast Fourier transforms (FFT) of the autocorrelation function of a time series. The method used was developed by Blackman and Tukey (1958) and is based on the Wiener-Khinchin theorem. This famous theorem states simply that if the Fourier transform of a series g(t) is G(w), and if the autocorrelation function of the series is R, then the Fourier transform of R is |G(w)|2 or the power spectrum of g (e.g., Press et al., 1989). The resulting power-spectrum estimate is called a correlogram. (An alternative that is not included in the Toolkit is direct or windowed FFT of the time series itself, called a periodogram.)
Typically, both periodograms and correlograms are performed on weighted versions of the time series or autocorrelation functions in order to reduce power leakage (artificially high power estimates at frequencies away from the true peak frequencies). Press et al. (1989, pp. 423-424) note that "when we select a run of N sampled points for periodogram spectral estimation, we are in effect multiplying an infinite run of ... data ... by a window function in time, one which is zero except during the total sampling time [NDt], and is unity during that time." The sharp edges of this window function contain much power at highest frequencies, which is imparted to the windowed signal and leads to power leakage. A similar argument can be made for correlograms. Weighting the data or correlation function by various tapered shapes (high in center and falling off to sides) is an accepted traditional approach to reducing power leakage. In the Blackman-Tukey approach, the power spectrum P(w) is estimated by
[3]
where rj is the autocorrelation function, M is the maximum lag considered and window length, and wj is the windowing function. Several window shapes are available in the Toolkit: Bartlett (triangular), Hamming (cosinusoidal), Hanning (slightly different cosinusoidal), and none.
The user may find that the various windows of the same widths give similar results. A more pertinent question to the user is how wide the windows should be. Kay (1988, p. 81) notes that the averaging associated with windowing a series reduces the resolution of the methods, from the frequency intervals of 1/N, to a windowed frequency intervals of about 1/M. Thus, wide windows yield lower resolution.
However, resolution is traded off against increasing variance of the power-spectrum estimate. At the extreme, a single (M=N) direct application of FFT to an unwindowed time series results in a periodogram with a theoretical standard deviation of the estimates equal to the estimates at each frequency, regardless of the number of observations in the time series (Press et al. 1989, p. 423). Averaging the results from many short data windows throughout the series (or autocorrelation) effectively increases the number of independent samples used in estimation and thereby reduces the estimation variance. Kay (1988, section 4.5) shows that the variance of a power spectrum obtained by a windowed correlogram is 2M/3N of the estimated power at each frequency. Thus more (shorter) windows are desirable in order to reduce the estimate variance.
Consequently, Kay (1988) recommends that windows should be no more than one-fifth to one-tenth the total number of data points (to obtain desired estimate-variance reductions) and not too much smaller (in order to retain the ability to distinguish between powers at neighboring frequencies and to obtain the desired leakage reductions). Theoretical estimates of variance for Blackman-Tukey power spectra are available (see for example, Kay, 1988) and thus the Toolkit provides error bars in the Blackman-Tukey power-spectrum plots in the spectra files it writes.
The Blackman-Tukey spectrum method (or close relatives) is available in other statistical packages so that this part of the Toolkit provides a link to other packages. As a "traditional" method, the correlogram is intended to provide a simple method against which the other more complicated methods provided in the Toolkit can be judged or validated. When the correlogram results are adequate to describe a time series (or SSA reconstruction), the other spectrum methods can be viewed as useful but possibly not necessary elaborations. More commonly, the MEM method (at least) will be useful because of its much greater spectral resolution.
 [5]
[5]
where w(k) is some weighting function and r(k) is the autocorrelation for lag k. Thus, the power spectrum is represented as a simple Fourier series. In contrast, MEM represents the power spectrum by
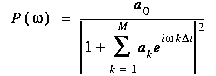 [6]
[6]
where the {ak, k=1,...,M} are now AR coefficients of the original series (Press et al., 1989, section 12.8). By the Wiener-Khinchin theorem, equation [6] must also equal the Fourier Transform (FT) of the autocorrelation function for a truly AR process. This property allows equation [6] to be fitted based on sample autocorrelation properties up to lag M. However, the Toolkit uses Burg's (1978) algorithm which should improve MEM's resolution (see discussion of Burg algorithm in "Singular-Spectrum Analysis" section).
The MEM representation ensures that: (1) the power spectrum can contain up to M poles, i.e., singularities where the denominator goes to zero and the power becomes large in a narrow frequency band, and (2) the power spectrum is not forced into the parametric mold of a Fourier series. (The number of poles M is referred to as MEM order in Toolkit menus.) The former aspect of MEM allows a more natural description of spectral lines. The latter aspect of MEM allows a more data-adaptive description of the overall power-spectrum form, giving a greater effective resolution. One way of understanding this increased resolution is to notice that a simple Fourier-series representation of the function described by equation [3] may require an infinite number of terms, rather than only the N terms in equation [2]. The "longer" representation of the MEM estimate yields an effectively much smaller Nyquist limit on frequency resolution.
MEM produces high-resolution power spectra that distinguish between contributions from nearby harmonics, as well as providing great precision in identifying the frequency of individual harmonics. The number of peaks--real and spurious--increases with M. Thus, the method regularly yields spurious peaks. When M is too small, resolution of multiple harmonics is limited, and when M is too large, spurious peaks are likely. The Toolkit requires that the user choose a number of poles and the number of frequencies at which the spectrum is to be estimated. Press et al. (1989, p. 433) recommend that "in practice, ... one usually wants to limit the ... number of poles ... to a few times the number of sharp spectral features that one desires it to fit [in order to reduce the opportunities for spurious peaks]. With this restricted number of poles, the method will smooth the spectrum somewhat...While exact values [of M] depend on application, one might take M = 10 or 20 or 50 for N = 1000 or 10000." The interactive approach provided by the full Toolkit allows the user to explore the sensitivity of results to the number of poles used.
In addition to the problem of spurious peaks, Marple (1987) indicates that the resolution of MEM is inversely related to the signal-to-noise ratio (falling off as about the -1/3 power of signal-to-noise ratio). MEM's tendency to yield spurious peaks and reduced resolution in the presence of noise only partially overshadows its strength as a precise spectral tool. The weaknesses can be remedied partly by (a) determining which peaks survive reductions in M, (b) comparing MEM spectra to those produced by correlogram and MTM which generally should not share spurious peaks with MEM, and (c) using SSA to pre-filter the series and thus to decompose the original series into several components, each of which contains only a few harmonics (so that small M values can be chosen; see Penland et al., 1991). The ease with which these various analyses can be interwoven in the Toolkit was a major motivation for its development.