QTCM Sample Figures

Model (QTCM1V2.0) simulated monthly mean precipitation on the equator through the period 1982-1998.

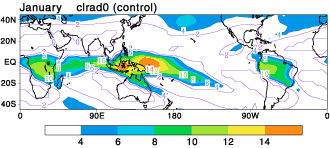
Model (QTCM1V2.0) climatology January mean precipitation
for the period 1982-1998.
QTCM Sample Figures | ||||
| This page provides links to figures produced from QTCM model output and observations with GrADs. They approximately follow the figures found in Zeng et al, 2000 from QTCM V2.1. | ||||
| Version 2.0 | Version 2.1 | Version 2.2 | Version 2.3 | Observations |
|
| ||||
 Model (QTCM1V2.0) simulated monthly mean precipitation on the equator through the period 1982-1998. |

Model (QTCM1V2.0) climatology January mean precipitation |
|||