QTCM Sample Figures (Version 2.1)
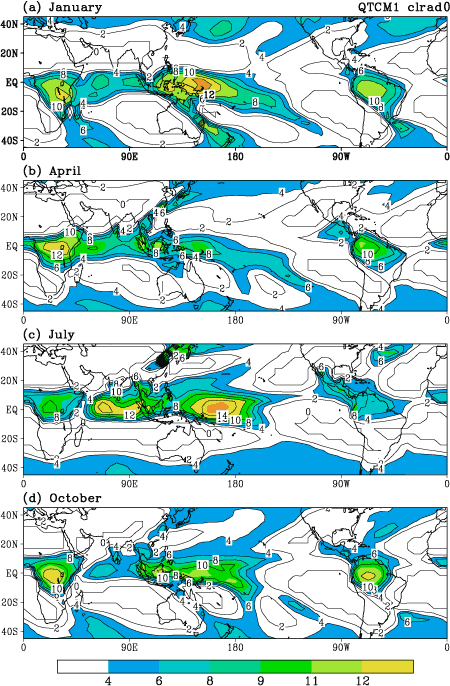 Model climatological monthly mean precipitation for the perion 1982-98; using the cloud-radiation package clrad0. (a) Jan, (b) Apr, (c) Jul, (d) Oct. Contour interval 2 mm/day, shaded above 4 mm/day. (Zeng et al, 2000) |
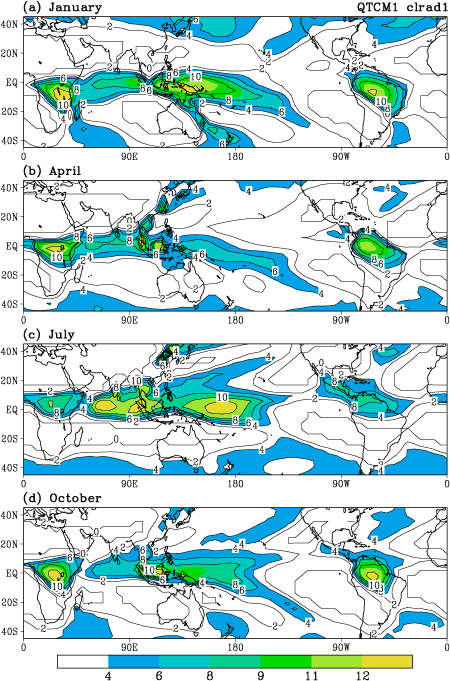 Model climatological monthly mean precipitation for the perion 1982-98; using the cloud-radiation package clrad1. (a) Jan, (b) Apr, (c) Jul, (d) Oct. Contour interval 2 mm/day, shaded above 4 mm/day. (Zeng et al, 2000) |
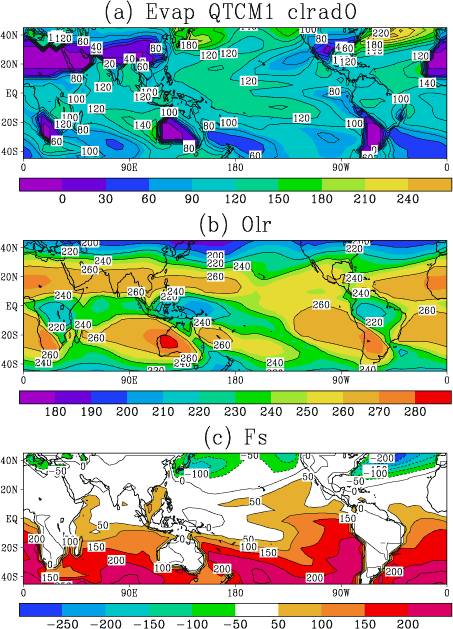 Model-simulated Jan fluxes using cloud-radiation package clrad0 of (a) evaporation, contour interval 20 W/m*m; (b) outgoing longwave radiation, contour interval 20 W/m*m; (c) downward net surface energy flux, contour interval 50 W/m*m. (Zeng et al, 2000) |
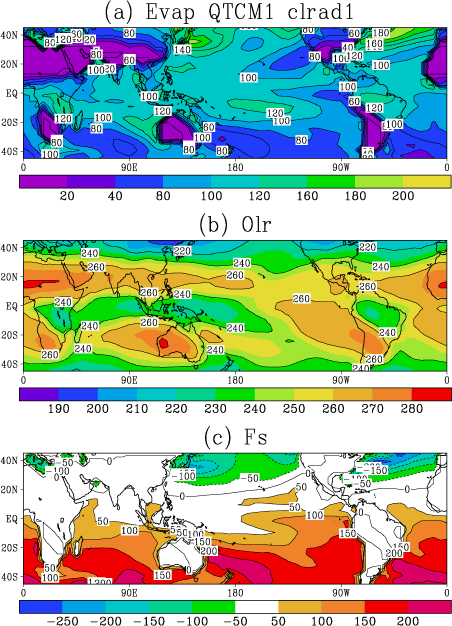 Model-simulated Jan fluxes using cloud-radiation package clrad0 of (a) evaporation, contour interval 20 W/m*m; (b) outgoing longwave radiation, contour interval 20 W/m*m; (c) downward net surface energy flux, contour interval 50 W/m*m. (Zeng et al, 2000) |
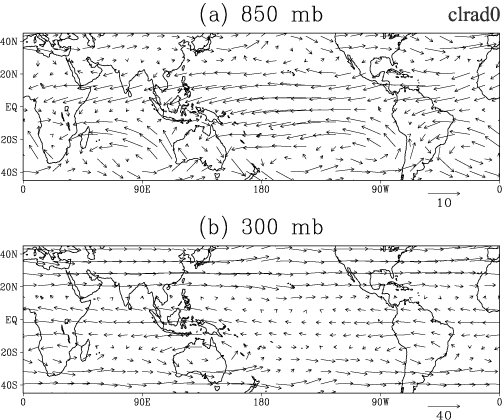 Model-simulated Jan climatological winds at (a) 850, (b) 300 mb, using cloud-radiation package clrad0, in m/s. |
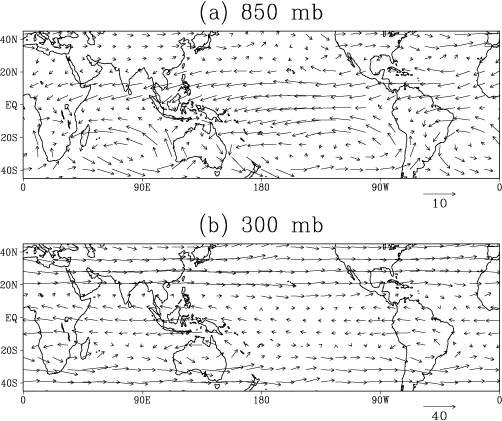 Model-simulated Jan climatological winds at (a) 850, (b) 300 mb, using cloud-radiation package clrad1, in m/s. (Zeng et al, 2000). |
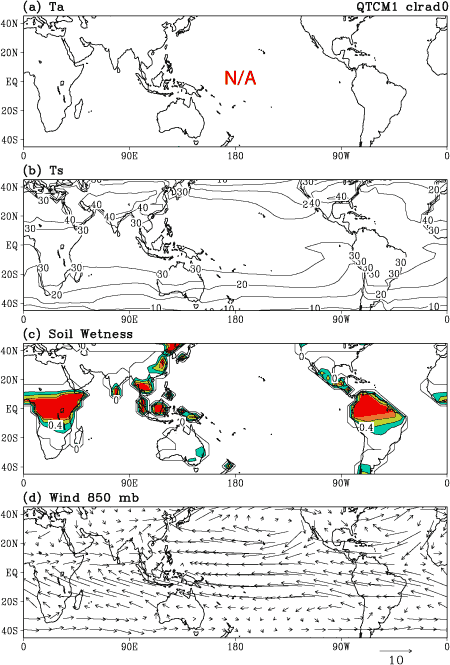 Model Jul climatology using cloud-radiation package clrad0: (a) air temperature averaged between 500 and 200mb. Not Available (N/A); (b) surface temperature (simulated ground temperature and observed SST), contour interval 5C; (c) relative soil wetness, contour interval 0.2; (d) 850 mb winds in m/s. |
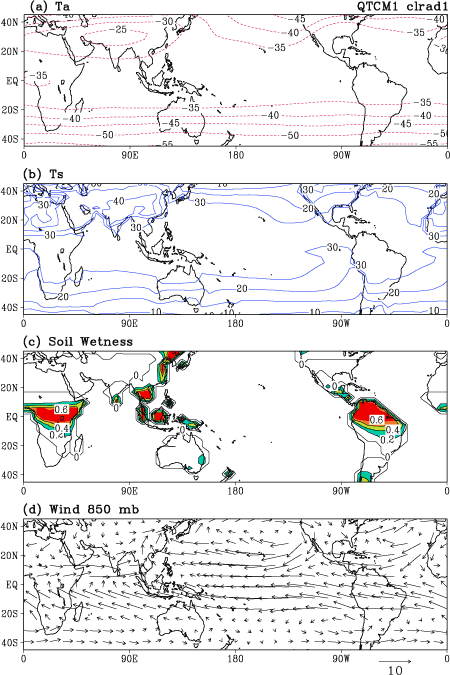 Model Jul climatology using cloud-radiation package clrad1: (a) air temperature averaged between 500 and 200mb, contour interval 5C; (b) surface temperature (simulated ground temperature and observed SST), contour interval 5C; (c) relative soil wetness, contour interval 0.2; (d) 850 mb winds in m/s. (Zeng et al, 2000). |
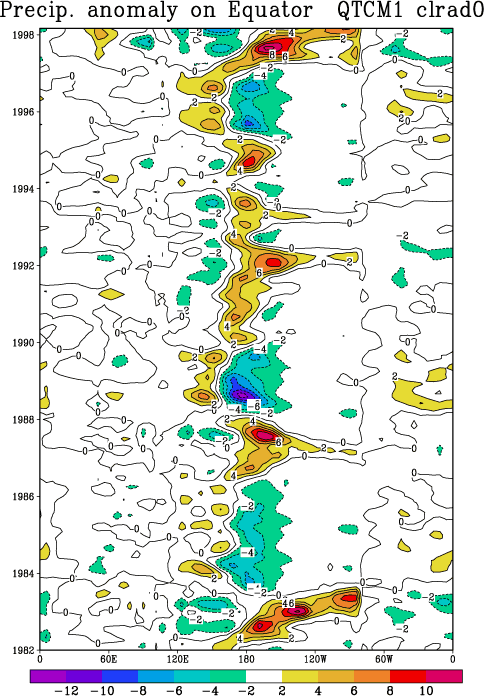 Model-simulated monthly mean precipitation on the equator through the period 1982-98. Contour interval 2 mm/day. (Cloud-radiation package clrad0). (Zeng et al, 2000). |
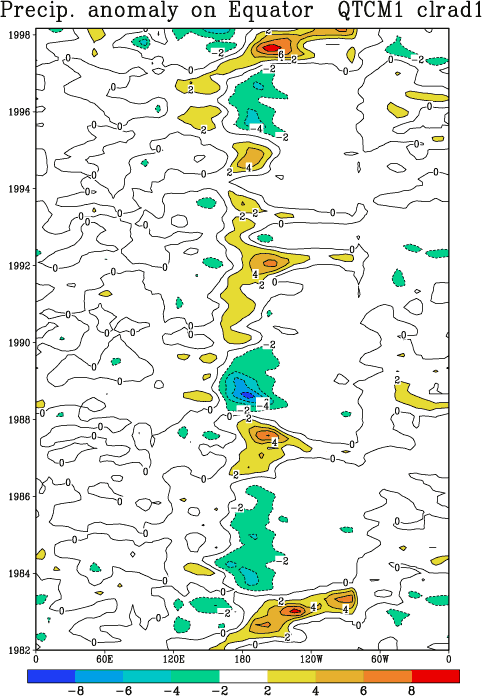 Model-simulated monthly mean precipitation on the equator through the period 1982-98. Contour interval 2 mm/day. (Cloud-radiation package clrad1). |
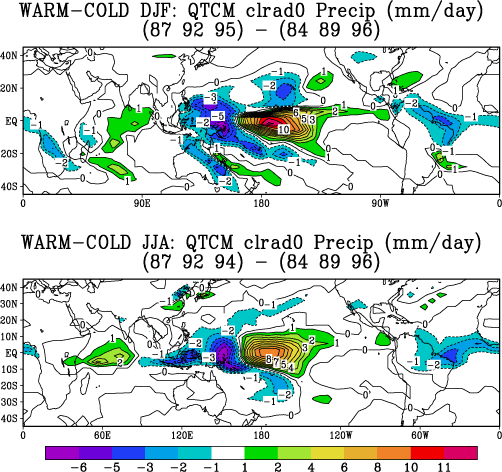 ENSO composite precipitation differences. Three warm events (1986/87, 1991/92, 1994/95) minus three cold events (1983/84, 1988/89, 1995/96). (a) Northern winter (Dec-Feb), (b) summer (Jun-Aug). Contour interval 1 mm/day. (Zeng et al, 2000) |
|
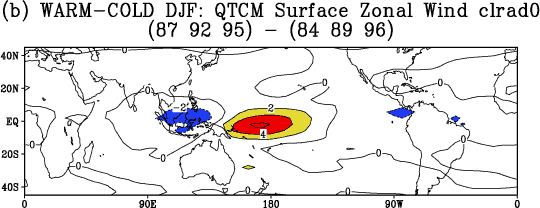 Dec - Feb. ENSO composite differences of surface zonal wind in m/s. (Zeng et al, 2000) |
|
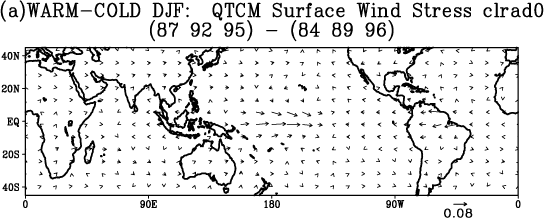 Dec-Feb ENSO composite differences of surface sind stress in N/m*m. (Zeng et al, 2000) |
|
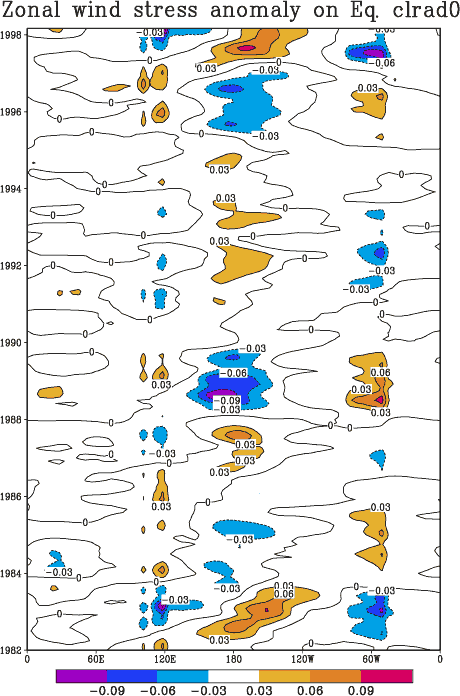 Model-simulated zonal wind stress on the equator from 1982-98, using cloud-radiation package 0, contour interval 0.03 N/m*m. (Zeng et al, 2000) |
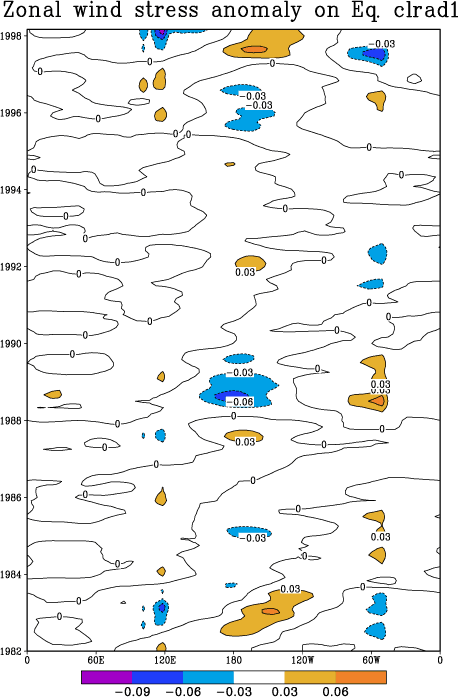 Model-simulated zonal wind stress on the equator from 1982-98 using cloud-radiation package 1, contour interval 0.03 N/m*m. |
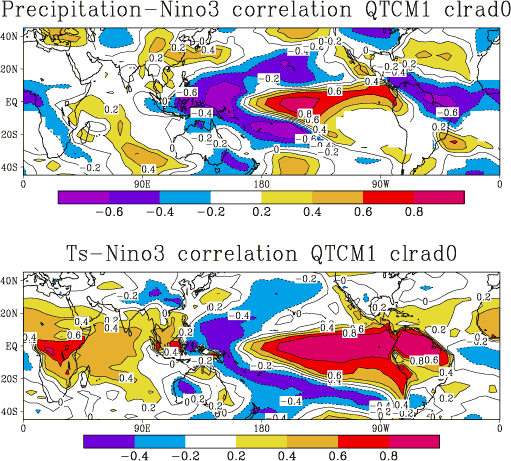 Correlations between Nino3 and model-simulated precipitation and surface temperature (observed SST over ocean), calculated using the monthly output for the period 1982-98. |
|
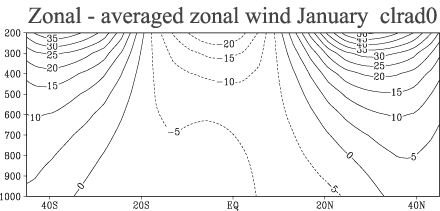 Zonally averaged zonal wind for January using cloud-radiation package 0. |
 Zonally averaged zonal wind for January using cloud-radiation package 1. |