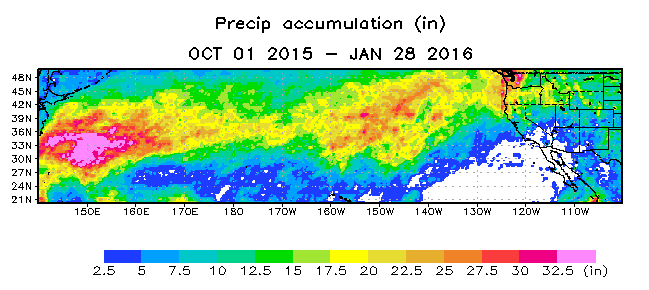
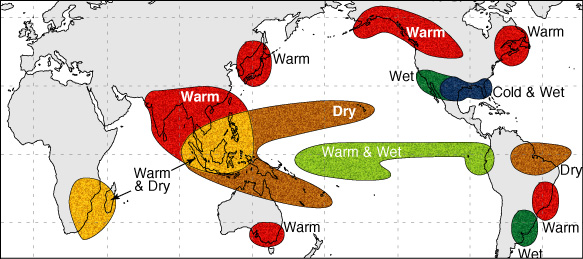
The above movie shows satellite observations of rainfall from the Tropical Rainfall Measuring Mission (TRMM) satellite. The top map shows winter storms during the current El Niño winter in units of inches per day. The bottom map shows the accumulated rainfall for these same storms.
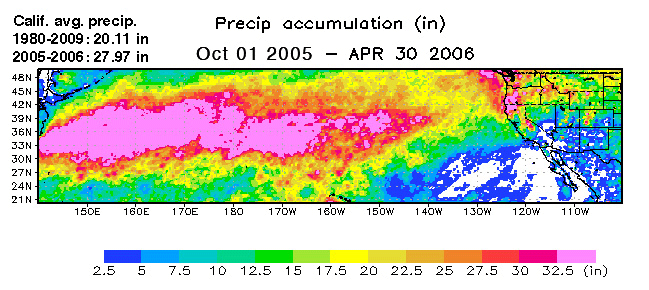
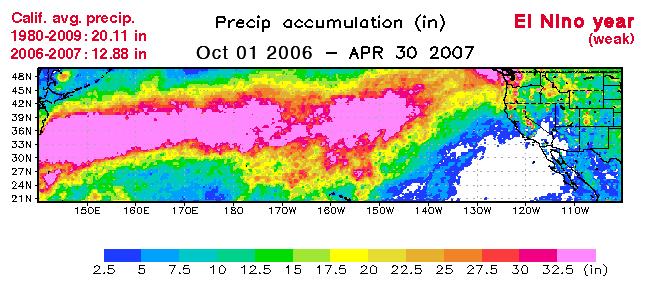
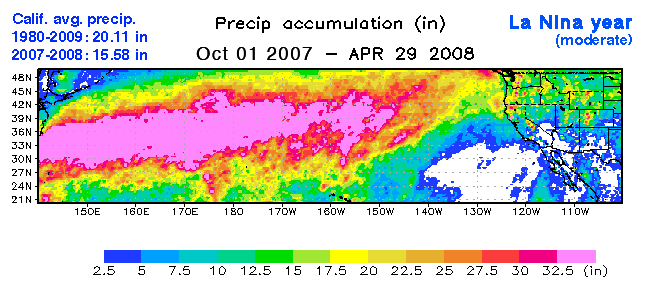
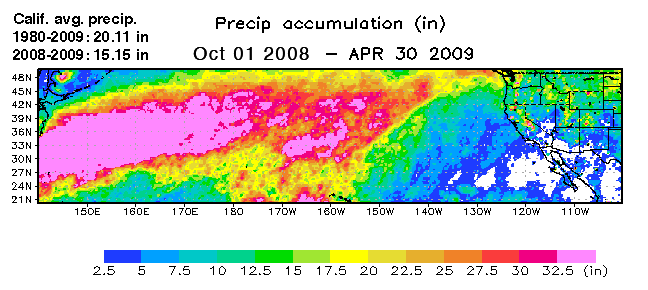
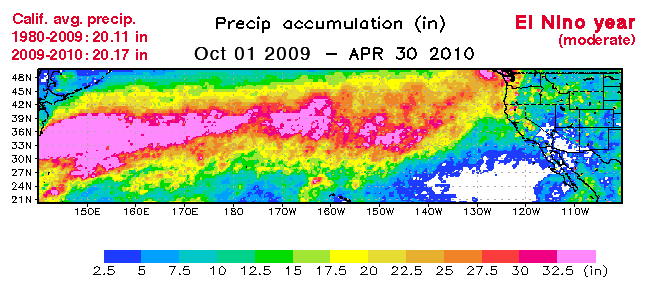
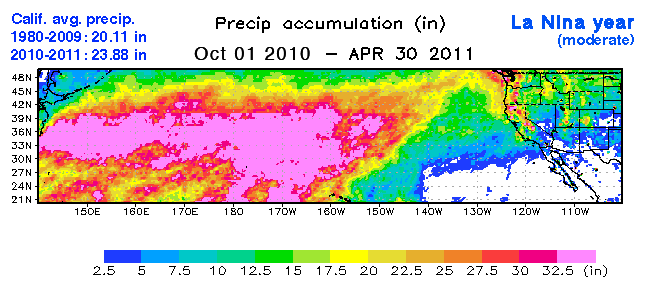
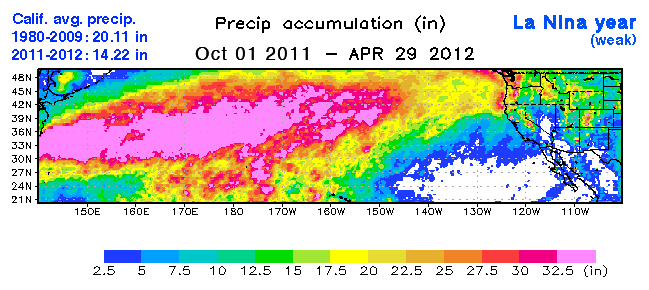
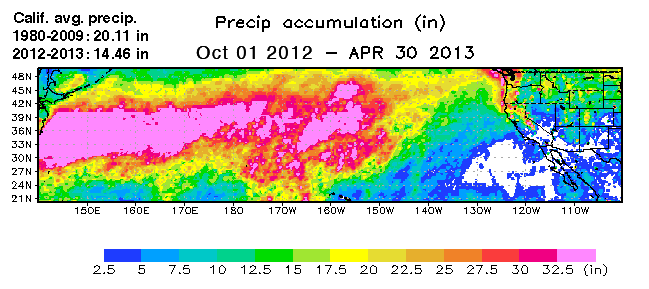
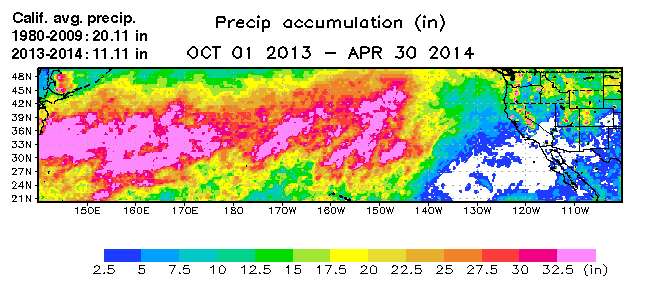
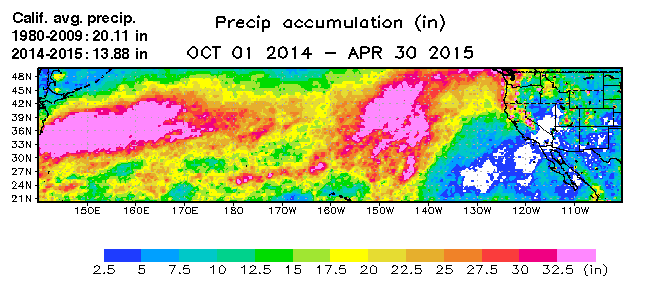
Below is the Oct. through Apr. accumulations for the last ten years. Note the storm track indicated roughly by the yellow - pink colors of previous years compared to this year's El Nino inspired storm track shaping up.

