

 |
 |
 |
 |
Recently, Groth and Ghil (2011) have demonstrated that a classical M-SSA analysis suffers from a degeneracy problem, namely the eigenvectors (also called empirical orthogonal functions or EOFs) do not separate well between distinct oscillations when the corresponding eigenvalues are similar in size. This problem is a shortcoming of principal component analysis in general, not just of M-SSA in particular. In order to reduce mixture effects and to improve the physical interpretation, Groth and Ghil (2011) have proposed a subsequent Varimax Rotation of the spatio-temporal EOFs (ST-EOFs) of the M-SSA. To avoid a loss of spectral properties (Plaut and Vautard 1994), they have introduced a slight modification of the common varimax rotation that does take the spatio-temporal structure of ST-EOFs into account.
Here we demonstrate benefits of introducing Varimax Rotation into the M-SSA analysis on a low signal-to-noise multivariate dataset. The synthetic test series consists of 6 spatial channels, each with a length of 130 data points; this series represents a sum of 4 distinct spatio-temporal oscillatory modes, contaminated by large-amplitude temporal red noise. These modes account for similar variance, and MSSA with Varimax Rotation helps their detection and reconstruction without mixing. Each of the oscillatory modes has a distinct frequency in time (from a low-frequency of f=0.133 to a high-frequency of f=0.435); they also have varying amplitude and phase shift across the spatial channels (see Matlab plotting scripts included with the data set).
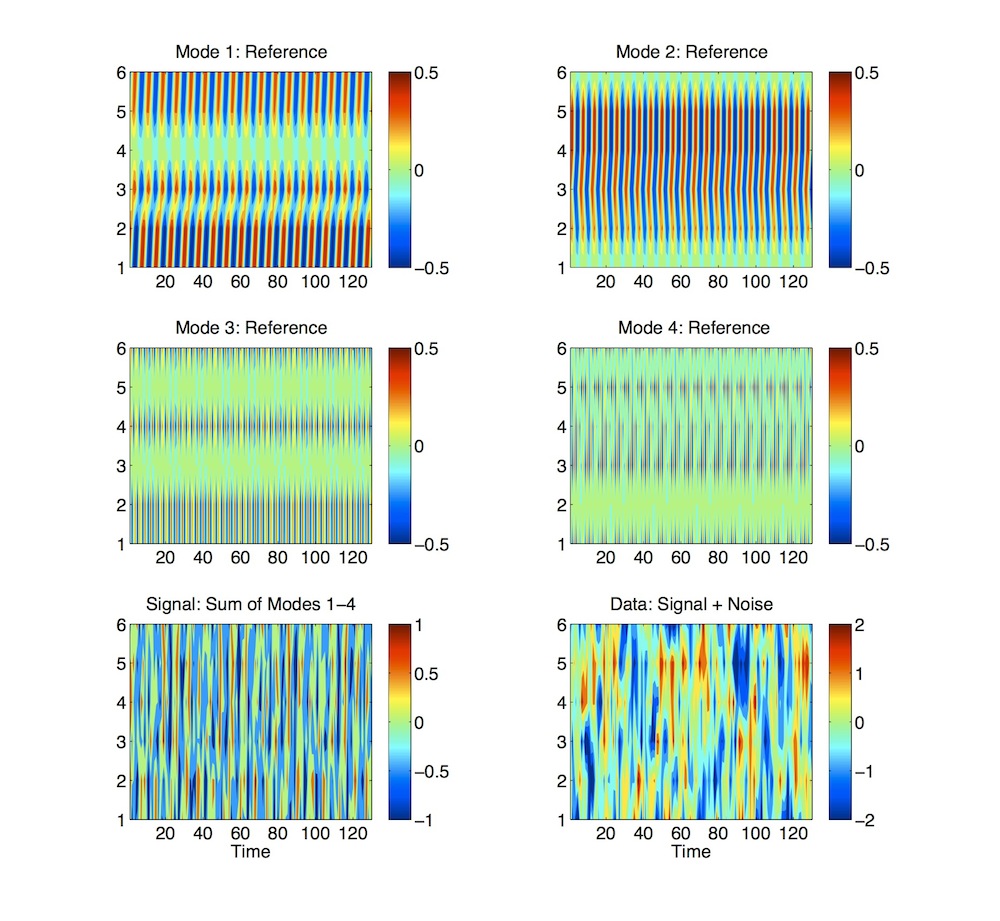
To read the data we use the Read Matrix function from the File/Data menu on the main panel, which places the input file data into a matrix with a default name "mat" of 130x6 size.
First, we perform analysis using standard MSSA without Varimax Rotation. Selecting the `MSSA' option from the Analysis Tools menu on the main panel launches the following window, showing its state after pressing Get Default Values button, and specifying the parameters as described below (leave for now Varimax box unchecked):
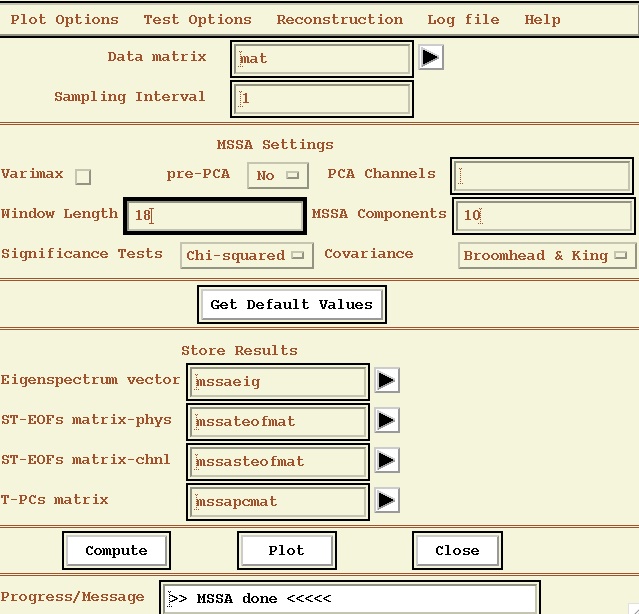
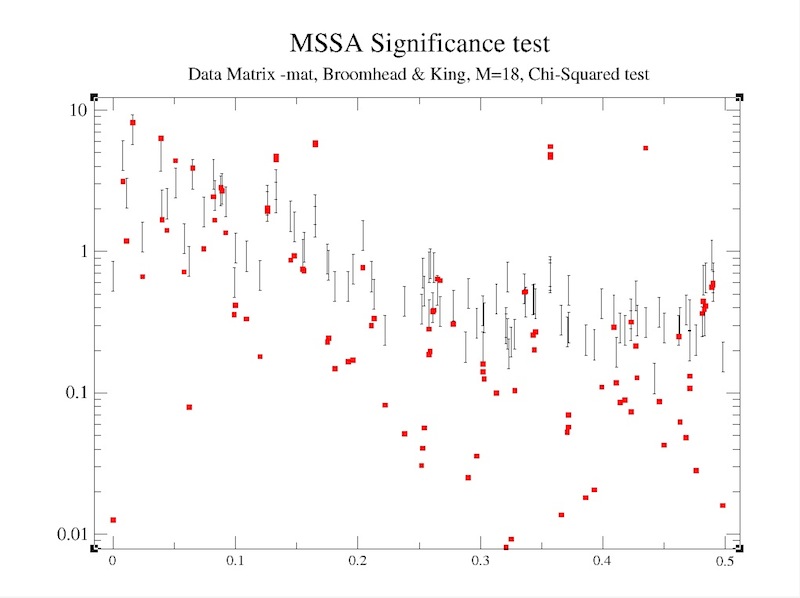
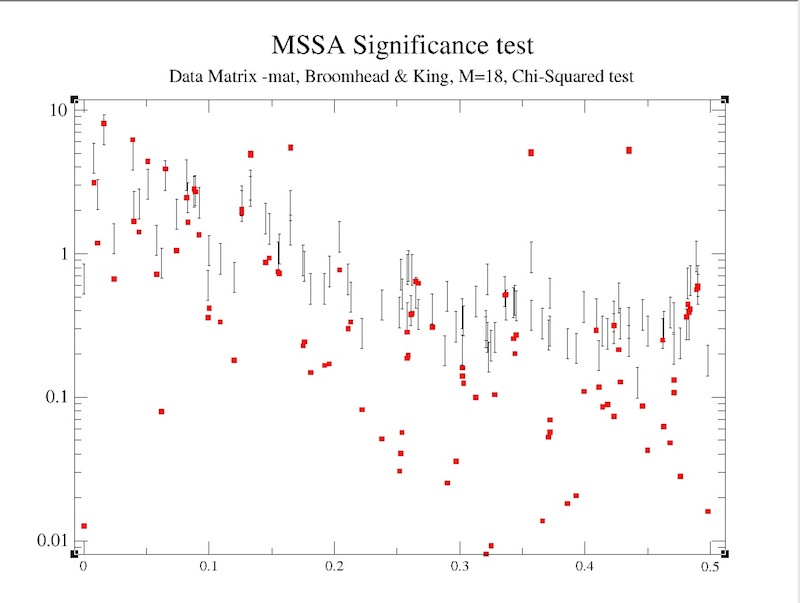
Then click Compute, followed by Plot, to obtain the following MSSA spectral estimate:
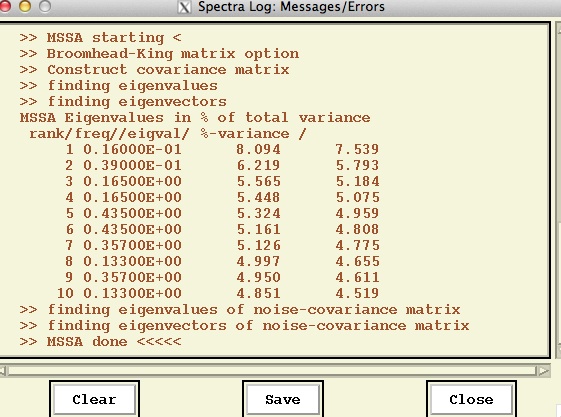
The frequencies and variances captured by each mode are displayed in a Log File:
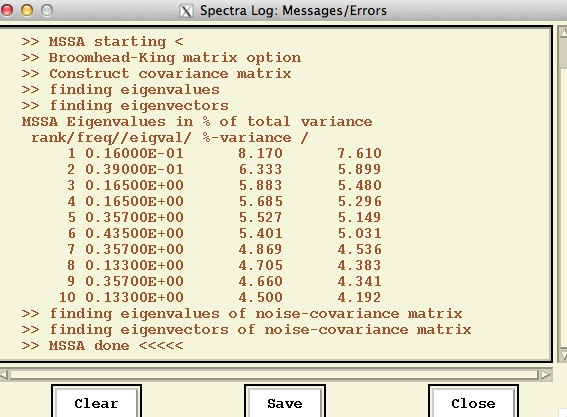
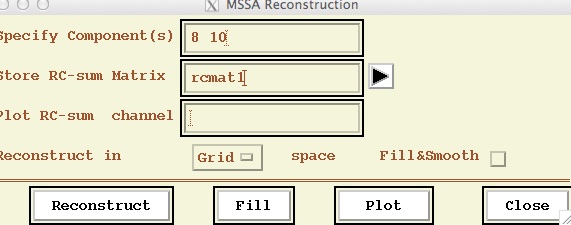
Notice a triplet at f=0.357 (ST-EOFs with rank # 5, 7 and 9) which is a clear manifestation of mode mixing with standard MSSA, as discussed above. We will focus here on time-domain reconstruction of low-frequency modes, f=0.165 (ST-EOFs with rank # 3 and 4) and f=0.133 (ST-EOFs with rank # 8 and 10) using the Reconstruction pull-down menu in the MSSA window as below, and store it in matrices rcmat1 and rcmat2, respectively.
Now we repeat the MSSA analysis wirth Varimax Rotation turned on (box checked on main panel) which will be applied to the leading MSSA components (10 in this case as specified on main MSSA panel), and obtain following MSSA spectral estimate:
Note that Varimax rotation removed mixing between high-frequency oscillatory modes, as also evident from the Log file:
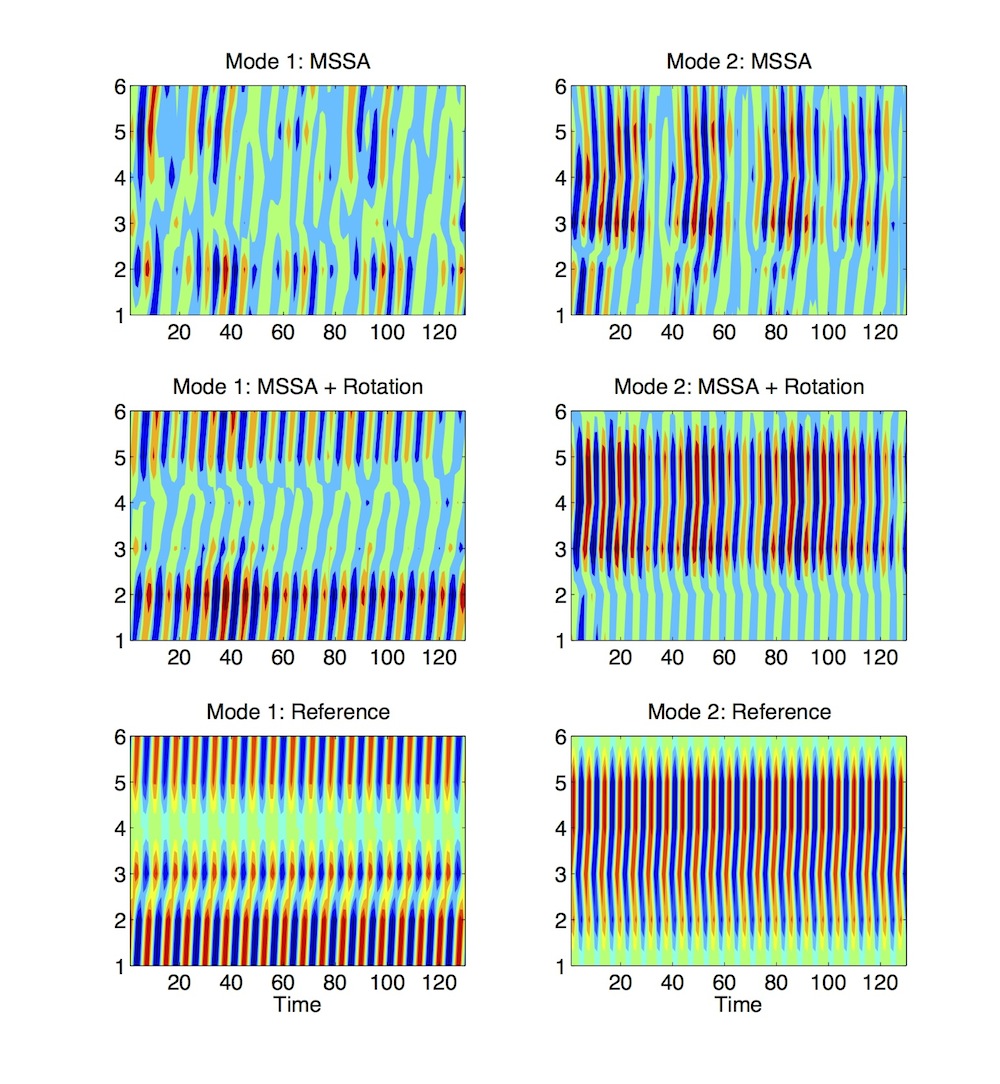
Next, we perform Reconstruction of low--frequency modes at f=0.133 (ST-EOFs with rank # 8 and 10) and f=0.165 (ST-EOFs with rank # 3 and 4) as above, but store them into rcmat1var and rcmat2var matrices, respectively. Using File/Data ->Write Matrix menu option, we write rcmat1, rcmat2, rcmat1var and rcmat2var into files with the same names.
By using extrenal 2-D plotting package (Matlab in this case), we can compare these reconstructions with reference data (below). The Varimax Rotation restored both amplitude modulation and phase shift between the channels much better then standard MSSA.
 |
 |
 |
 |