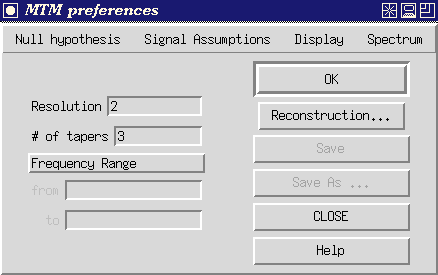
Figure 1. Control panel for Multi-Taper Method.

Figure 1. Control panel for Multi-Taper Method.
There are three (3) options that are changed by the user explicitly entering chosen values of parameters:
There are six (6) clickable buttons, some of which may not be active depending on what actions have been taken:
.

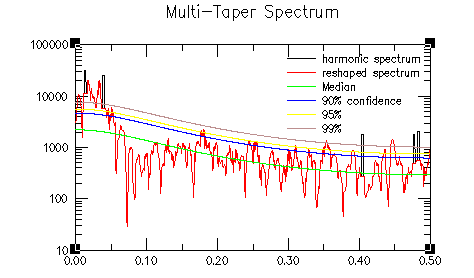
Figure 2. MTM spectrum for `soi'
(. X-axis units are cycles per month, and y axis is spectral density .
The `display'button in the menu will produce a plot of the reconstructed signal along with the raw data, while the `save' button will allow the user to save the reconstructed signal as a file.
There are four (4) menu items below the `MTM preferences' heading which allow the user to change various settings from their defaults:
The first subgroup of options is:
red noise
locally white
white
The choice of ``red noise''assumes a noise background that consists of a temporally integrated Gaussian white noise or ``AR(1)'' noise process. This null hypothesis is strongly motivated for dynamical reasons in the study of geophysical phenomena, and represents the default option of the Toolkit.
The choice of ``locally white noise'' assumes a colored noise process that varies slowly but arbitrarily with frequency. This choice is recommended if there is a priori reason to believe that the noise background has a complex structure.
The choice of ``white noise'' represents a good null hypothesis if absolutely nothing is known a priori about the physics or dynamics of the process producing the noise background.
The second subgroup of options is:
robust
raw
The ``robust'' noise background choice employs a robust estimator (median smooth) to find an optimal background fit to the empirical spectrum for measuring the signficance of narrowband signals. This choice guards against the contamination of noise paramater estimation by narrowband signal and significant trend contributions, and represents the default option.
The ``raw'' option estimates noise parameters directly from the unfiltered or ``raw'' time series. This option, albeit more traditional, is generally discouraged. It should be selected, however, if the user is interested in signals whose significance is measured only by the Thomson variance ratio test for periodicity, without regard to their significance as measured by their amplitude relative to the estimated noise background.
The third subgroup of options represents a choice between
the two options:
log fit
linear fit
AND a choice of the item
median smoothing
The ``log fit'' employs a criterion which minimizes the misfit of the robustly estimated background with the log of the spectral density. This provides a better conceptual fit to the spectrum when dynamic ranges are large, and is the suggested choice. It is the default option.
The ``linear fit'' employs a criterion which will weight the robust fit of the noise background by the amplitude of the spectrum. This choice is recommended if it is more important to fit the low-frequency, high-power part of noise background.
The ``median smoothing'' option is enforced for the ``robust'' noise background estimation and is thereby a default. The default is selection of a noise background based on the fit to a median smooth of the raw spectrum with a smoothing window of width f_smooth frequency units that is the larger of either f_Nyquist/6 or the full spectral resolution bandwith 2 p f_Rayleigh. This generally insures that the overall structure of the spectrum over the full ``Nyquist'' interval is recognized in the optimal background fit, while assuring that the fit is resistant to the influence of narrowband features in the spectrum. This value can be varied by the user within the range 2 p f_Rayleigh to 0.25 f_N. As with the choice of ``log fit'' and ``linear fit'', any results which show great sensitivity to the value of the median smoothing window f_smooth over that range should be interpreted with some caution.
The choice ``either'' indicates that the spectrum should
for the vertical axis of the displayed spectra:
The choice ``either'' indicates that the spectrum should be tested both for the presence of narrowband signals whose significance is measured by their amplitude relative to the estimated noise background, and for the presence of ``harmonic'' signals which are significant as measured by the Thomson variance ratio test for periodic signals. This is the default choice.
The choice ``narrowband'' will test the spectrum only for the presence of narrowband signals, the former of the two possible signal detection procedures described above.
The choice ``harmonic'' will test the spectrum only for the presence of periodic signals, the latter of the two possible signal detection procedures described above.
The first group represents two mutually-exclusive choices
for the vertical axis of the displayed spectra:
log scale
linear scale
The choice ``log scale''indicates that spectra should be plotted by the conventional log(spectral density) vs frequency dependence, and is the default setting.
The choice ``linear scale'' conversely plots results using a linear vertical axis vs. frequency. This convention is more sensible for displaying the results of the ``harmonic peak test'' (see below).
The second group represents the choice of spectral analyses
or diagnostics to be displayed:
reshaped vs. harmonic spectrum
raw spectrum
harmonic spectrum
reshaped spectrum
harmonic peak test
Note that the first 4 choices share common spectral
density units and can be selected silmultaneously, while
the 5th display item exhibits variance-ratio units
and cannot be displayed silmutaneously with the
other choices.
The choice ``reshaped vs. harmonic spectrum'' indicates the the estimated continuous MTM spectrum or ``reshaped spectrum'' (the spectrum with estimated contributions of harmonic signals removed) should be shown along with the harmonic component of the spectrum. This is accomplished by showing the estimated continous spectrum by a solid curve, along with a dashed curve that rises above it to indicate the portion of the spectrum above the continuous background associated with a period signal. The latter component is shown as a narrow spike of breadth equal to the spectral estimation bandwidth. Four additional smooth curves are shown, in increasing vertical progression, for the median, 50%, 90%, 95%, and 99% significance levels relative to the estimated noise background. This is the default display item.
The choice ``raw spectrum''indicates that the raw MTM spectrum should be displayed. As above, signficance curves are also shown.
The choice ``harmonic spectrum'' indicates that the estimated harmonic or periodic component of the spectrum should be displayed, as a function of frequency.
The choice ``reshaped spectrum'' indicates that the reshaped spectrum (see above) should be shown on its own, along with confidence intervals.
The choice ``harmonic peak test'' indicates that the variance-ratio test for significance of harmonic signal detection should be shown as a function of frequency. Also shown are the median, 90,95,and 99% confidence levels for significant detection of a periodic signal relative to the assumption of locally-white noise.
The first group represents a choice between two methods
of estimating the MTM spectrum:
adaptive
high-resolution
The choice ``adaptive'' indicates that the adaptive MTM spectrum estimation procedure, most resistant to broadband spectral leakage, is to be employed. This is the default option.
The choice ``high-resolution'' indicates that the high-resolution MTM spectrum, involving a simple weighted average of the contributions of independent eigenspectra, should be calculated.
The 2nd choice represents a choice between three
mutually exclusive
possible normalization conventions of the spectrum:
none
N
1/dt
The choice ``none'' indicates a standard Fourier convention of a finite length time series in which the spectrum scales with the number of data points. This is the default convention.
The choice ``N'' represents a convention in which the spectrum is calculated per unit time by dividing by the length of the dataseries in in time units ``N'' (ie, a power spectral density).
The choice ``1/dt'' represents a convention in which the spectrum is scaled by the sampling interval (dt), approriate for the spectral estimate of a presumed time-limited signal such as a pulse.
The 3rd item regards the ``reshaping procedure'':
The user indicates whether or not the ``reshaping'' procedure (used to separate the continuous and harmonic portions of the spectrum) should be performed. The procedure is performed by default. The user also selects a treshold for significance of harmonic peak detection (90%,95%,99%) in the reshaping procedure. The default setting is 95% significance. The user should be aware that chance statistics should lead to a 5% rate of spurious harmonic signal detection at the 95% level, corresponding to roughly 2-3 false positives over the Nyquist interval for a timeseries of length N=100 time units, underscoring Thomson's (1982) general warning that one should interpret with great caution significances of less than about 1-1/N.