Weather Radar Fundamentals


Doppler Velocity Measurements ยป Small-Scale Patterns

A plan view of idealized radial velocity.  Colors to the left of the radar are blue and green, while colors to the right are red and yellow.  A line of gray, indicating velocities of zero, bisects the radar area and passes through the radar location. Closed isodops exist within both halves of the radar image.

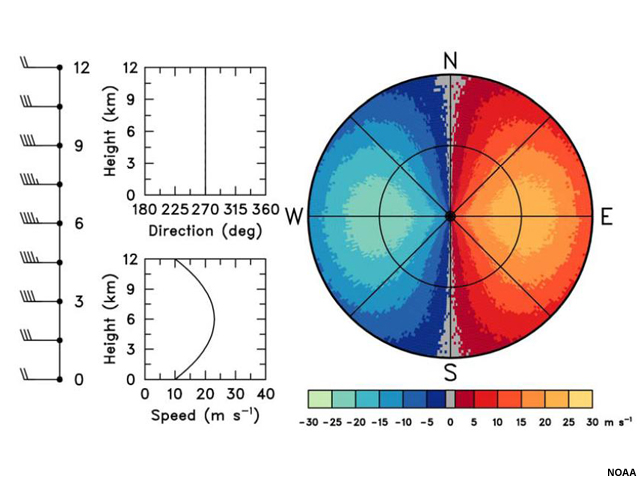
Earlier we saw the form a maximum in the overall environmental wind can take: a couplet of closed isodops with negative values on one side of the zero isodop and positive values on the other. This type of pattern also occurs for meso- and micro-scale phenomena, but for different reasons. There are two main types of small-scale couplets: ones indicating rotation and ones indicating convergence or divergence. A rotational couplet looks similar to the previous jet example, but usually at a much smaller scale embedded within the background flow.

The left panel shows velocity vectors within a 30 by 30 kilometer square located 100 kilometers north of the radar.  The arrows show a strong counterclockwise circulation about the center of the square. The right panel shows radial velocities over the square.  A zero isodop runs north-to-south and bisects the square.  On the right side of the zero isodop there are outbound velocities in red, with closed isodops surrounding a maximum that lies about 3 kilometers to the east of the square's center.  On the left side of the zero isodop there are inbound velocities in blue, with closed isodops surrounding a minimum that lies about 3 kilometers to the west of the square's center.

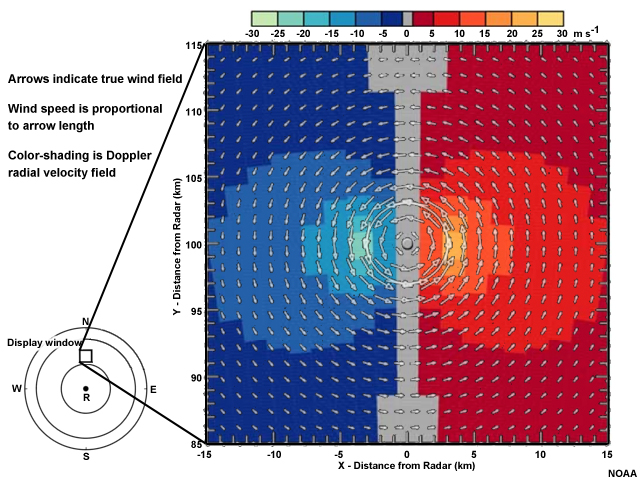
This image shows rotation occurring within a small portion of the radar's range. In this case, we see two sets of closed isodops. A line drawn from the radar location through the couplet will have the inbound velocity minimum to the left of the line and the outbound velocity maximum to the right.

The left panel shows velocity vectors within a 30 by 30 kilometer square located 100 kilometers north of the radar.  The arrows show a strong counterclockwise circulation about the center of the square. The right panel shows radial velocities over the square.  A zero isodop runs north-to-south and bisects the square.  On the right side of the zero isodop there are outbound velocities in red, with closed isodops surrounding a maximum that lies about 3 kilometers to the east of the square's center.  On the left side of the zero isodop there are inbound velocities in blue, with closed isodops surrounding a minimum that lies about 3 kilometers to the west of the square's center.

At such a small scale, this means that the winds are rotating rapidly in a counterclockwise fashion.

The left panel shows velocity vectors within a 30 by 30 kilometer square located 100 kilometers north of the radar.  The arrows show a strong counterclockwise circulation about the center of the square. The right panel shows radial velocities over the square.  A zero isodop runs north-to-south and bisects the square.  On the right side of the zero isodop there are outbound velocities in red, with closed isodops surrounding a maximum that lies about 3 kilometers to the east of the square's center.  On the left side of the zero isodop there are inbound velocities in blue, with closed isodops surrounding a minimum that lies about 3 kilometers to the west of the square's center.

The easterly and westerly winds in this circulation are approximately the same strength as the northerly and southerly ones, but are not recorded as such because they are nearly perpendicular to the radial. Rotating updrafts in thunderstorms commonly produce this feature at low- to mid-levels of the troposphere.

Base velocity image showing shades of green east of the radar and shades of orange west of the radar.  Further northwest from the radar, there is a small region of strong outbound velocities in red adjacent to a small region of strong inbound velocities in blue.

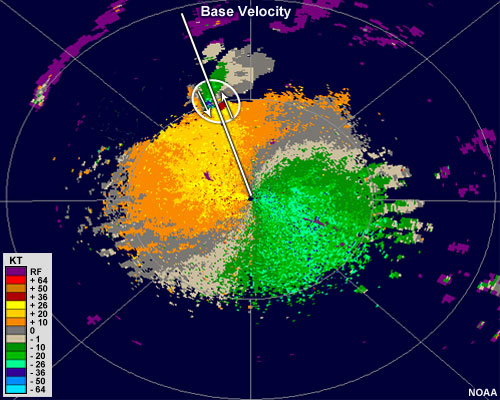
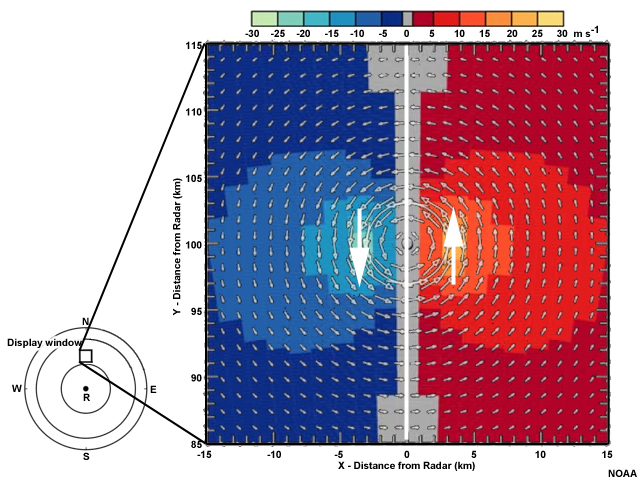
In this example you can clearly see a well-defined couplet north of the radar. Drawing on the radial, we see that maximum inbound velocities are found to left while maximum outbound velocities are to the right. In this case, there is no zero isodop between the two maxima, which is often the case with thunderstorm environments. Often, the circulation is not strictly rotational, but also possesses a degree of convergence or other shear in the nearby storm environment.

The left panel shows velocity vectors within a 30 by 30 kilometer square located 100 kilometers north of the radar.  The arrows show strong divergence away from the center of the square.  The right panel shows radial velocities over the square.  A zero isodop runs east-to-west and bisects the square.  Outbound velocities in red exist to the north of the bisection, with closed isodops surrounding a maximum that lies about 3 kilometers to the north of the square's center.  Inbound velocities in blue exist to the south of the bisection, with closed isodops surrounding a minimum that lies about 3 kilometers to the sorth of the square's center.

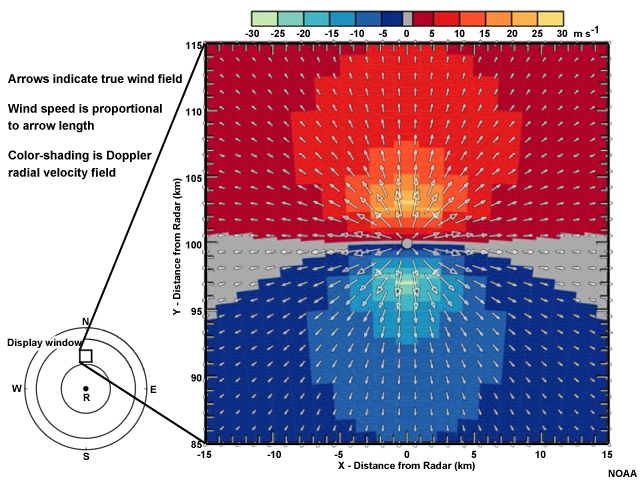
The other main type of couplet encountered in velocity images is one of convergence or divergence. It will look similar to other rotational couplets except the maxima will be oriented differently with respect to the radar beam.

The left panel shows velocity vectors within a 30 by 30 kilometer square located 100 kilometers north of the radar.  The arrows show strong divergence away from the center of the square.  The right panel shows radial velocities over the square.  A zero isodop runs east-to-west and bisects the square.  Outbound velocities in red exist to the north of the bisection, with closed isodops surrounding a maximum that lies about 3 kilometers to the north of the square's center.  Inbound velocities in blue exist to the south of the bisection, with closed isodops surrounding a minimum that lies about 3 kilometers to the sorth of the square's center.

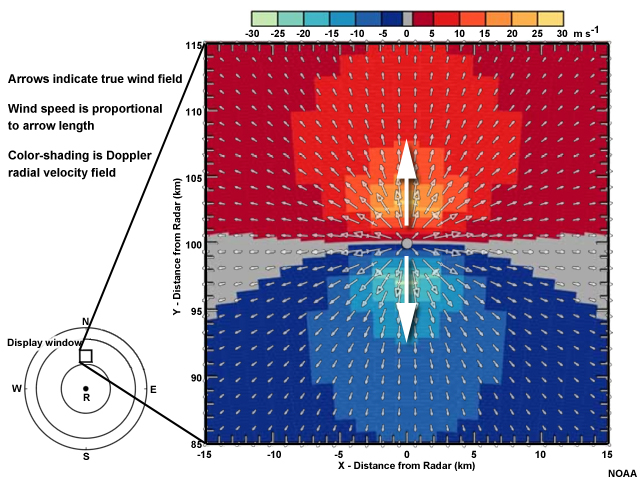
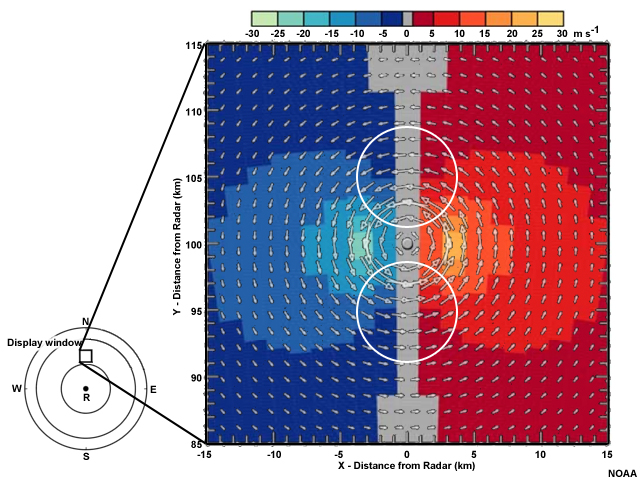
In this example, we see that a radar beam at this location would first see inbound velocities, quickly changing to outbound velocities farther downrange. This means that the winds are diverging away from the midpoint in this couplet. This can occur with strong thunderstorm downdrafts. A convergent couplet would look the same, except the positions of the outbound velocities would be found closer to the radar and the inbound ones farther away.

Radial velocity image showing pronounced divergent couplets just to the south and just to the northeast of the radar.

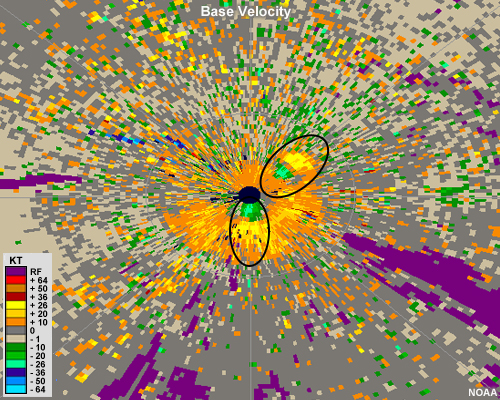
In this example, one divergent couplet is located northeast of the radar. We can see that the radar beam would first encounter outbound velocities, and then at the couplet, a maximum of inbound velocities followed quickly by a maximum of outbound velocities. A second divergent couplet from another microburst is south of the radar.

Summary image showing storm-scale rotational couplets existing in all four cardinal directions from the radar.  All couplets are centered about a zero isodop that is parallel to the radar beam in any given direction.

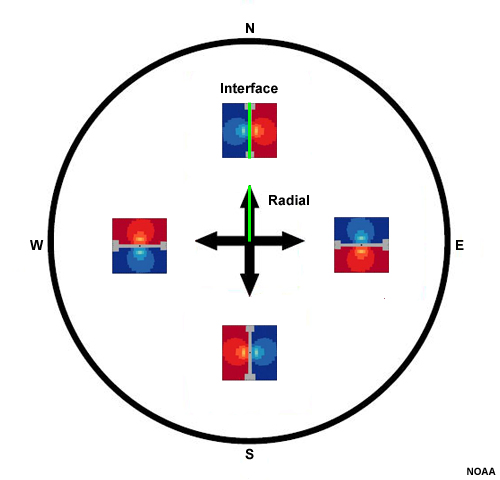
Another quick way to determine what type of couplet you're seeing is to draw a line that represents the interface between the inbound and outbound velocities. If the interface is parallel to a radar beam coming out to that point, then it is a rotational couplet.

Summary image showing storm-scale divergent couplets existing in all four cardinal directions from the radar.  All couplets are centered about a zero isodop that is perpendicular to the radar beam in any given direction.

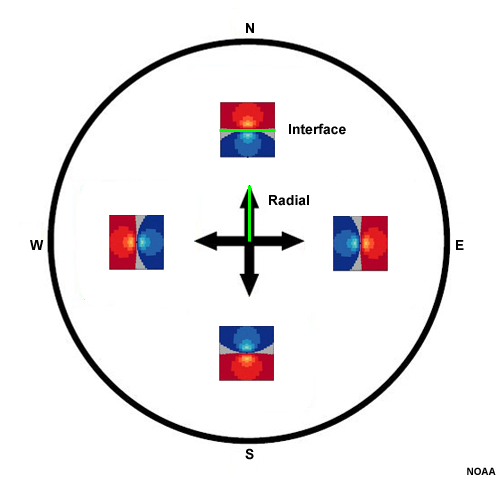
If the interface is perpendicular to it, then it is convergent or divergent. Many times, you will encounter some of both happening. We will examine some examples in the upcoming chapter that discusses convection.