Doppler Velocity Measurements » Principles » Doppler Radars
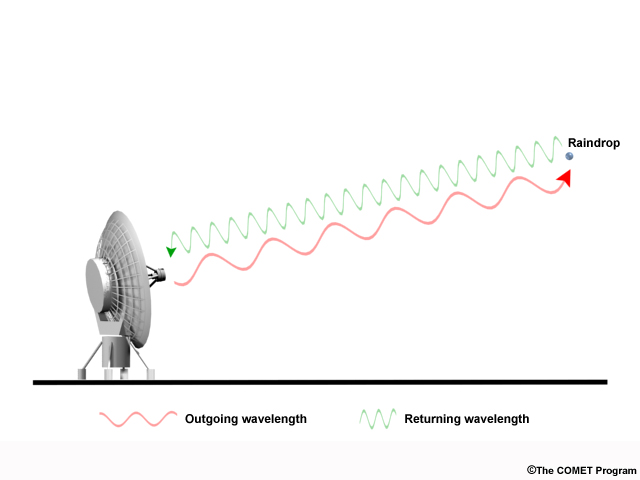
Because the same phenomenon occurs with electromagnetic waves, radars have been designed to measure this shift in frequency. The magnitude and direction of the shift give information about the motion of the target objects either toward or away from the radar. This measurement is called the "radial velocity."
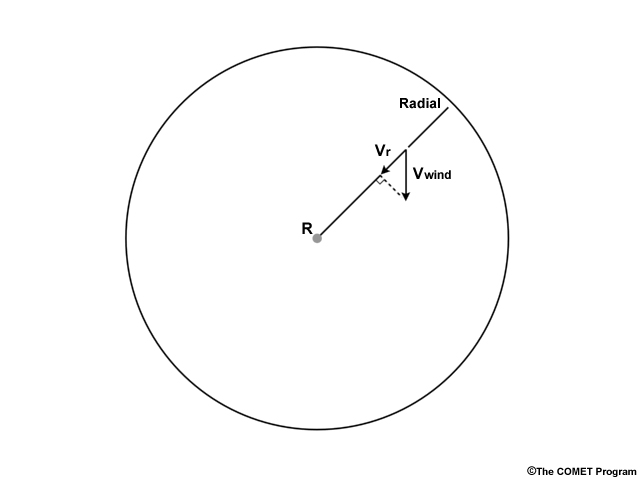
It is important to note that the radar can only tell whether a target is moving toward or away from it, and how fast it is doing so. The actual speed and direction of the wind will only be observed at points where the radar beam aligns perfectly parallel to a target's direction of travel. In all other instances, only the component of the target's motion that is parallel to the radar beam is measured and plotted as the radial velocity value.
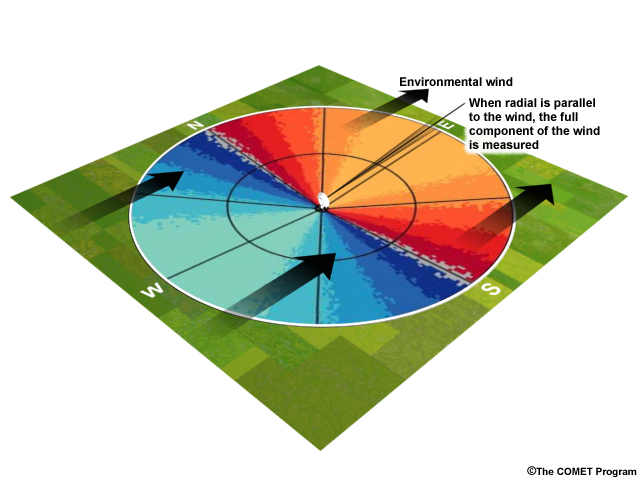
Let's look at a simple example in which the wind is blowing from the west at the same speed in all locations. When the radar beam is pointing directly to the east, the radar will measure the component of the wind that is parallel to the beam. In this case the radial velocity is the same as the environmental wind, which is displayed in a shade of red and orange to represent movement away from the radar.
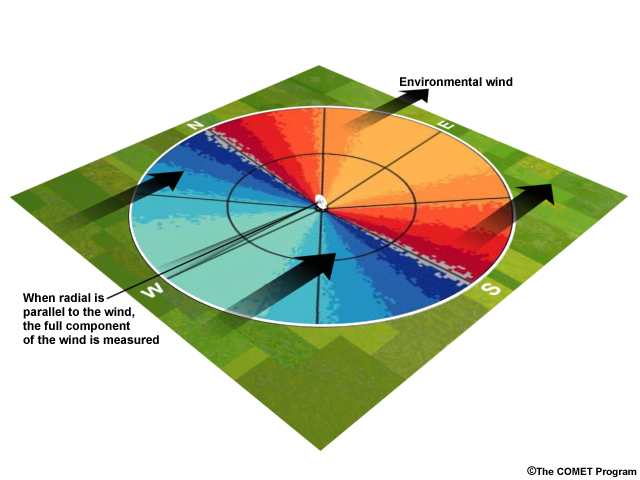
Similarly, when the radar beam points directly west, the radial velocity will be the same as the environmental wind, but will be displayed in green and blue shades to indicate movement toward the radar.
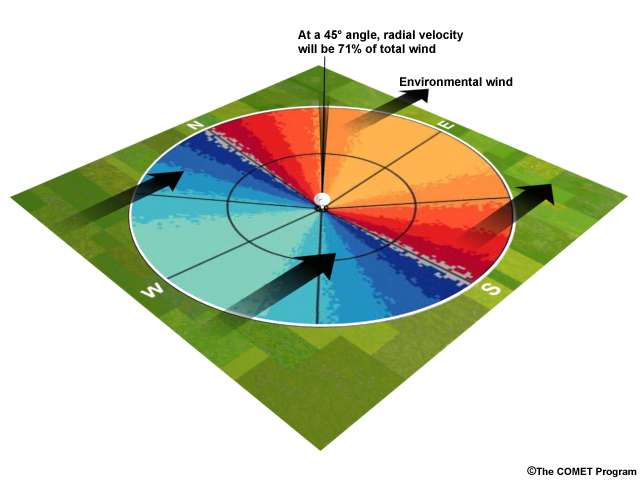
As the radar beam rotates, it will measure only the component of the wind that is parallel to it. In this case, at a 45° angle, it will measure about 71% of the total wind, so the reported radial velocity will be a lower speed than the actual environmental wind.
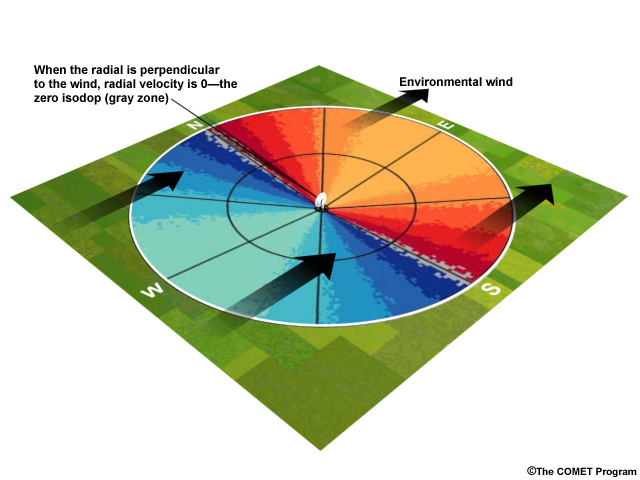
The radial velocity will be zero when the beam is perpendicular to the wind direction, as there is no parallel component.
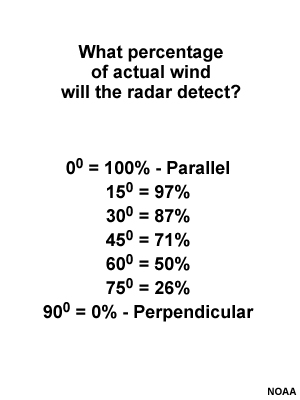
Note that the actual velocity of the wind did not change at any time or location in this example, just the angle at which it is viewed by the radar. This is why the speed of the wind can appear to greatly change over the viewing area on radial velocity images.
This may sound tricky at first, but with practice one can learn how to interpret these images and use them as a short-term diagnostic and forecasting tool.