Doppler Velocity Measurements » Large-Scale Wind Interpretation » Discontinuities
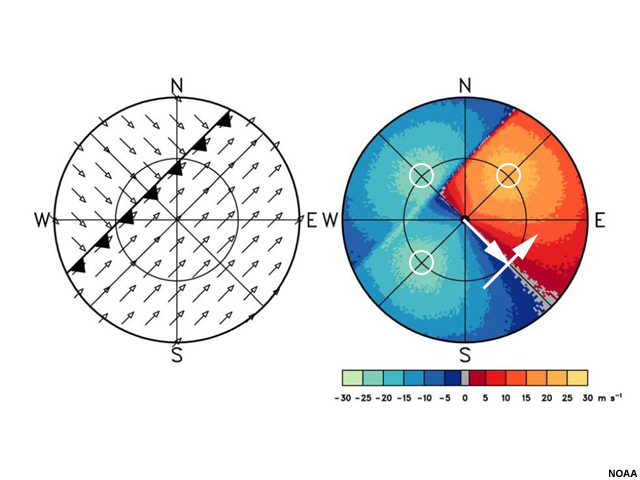
Here, we see that northwesterly flow associated with a cold front has a maximum near the level of the first range ring and is overtaking southwesterly flow that also has a maximum at the level of the first range ring.
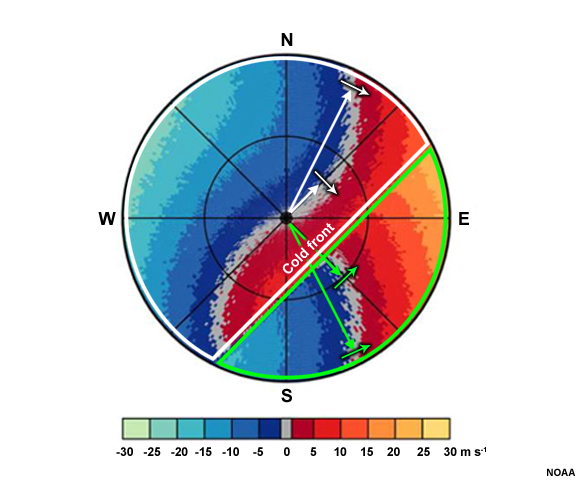
In some cases the radial velocity may look more like this. We can see that backing winds (turning counterclockwise with height) are occurring in the area outlined in white in the image, while the southeast portion (outlined in green) shows winds that appear to be veering (turning clockwise with height). Backing indicates cold air advection, while veering signals that warm air advection is occurring. This pattern would indicate a cold front moving into an area of warm flow with a southerly component, and we can see a sharp discontinuity that signifies the location of the front.
So far, we have examined large-scale interpretation of the environmental wind using radial velocity. Let's now take a look at some of the smaller scale circulations that can be diagnosed with radar.