Winter Weather » Liquid versus Ice
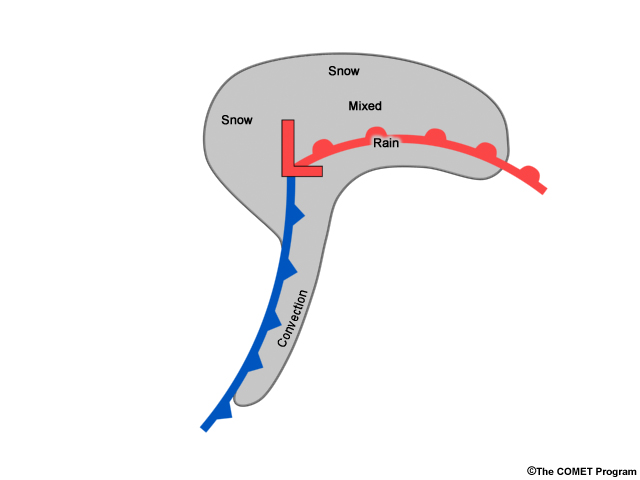
In many cases, the distribution of precipitation within a mid-latitude cyclone looks something like this. But that is not always the case, and using radar to determine where frozen precipitation exists is usually somewhat difficult.
Earlier we discussed that radar reflectivity was typically about 7 dBZ lower for a sphere of ice than a sphere of water due to ice scattering less energy than water. However, when one wants to determine where snow exists using non-dual-polarized radar, simply looking for regions of lower reflectivity is not a reliable method.
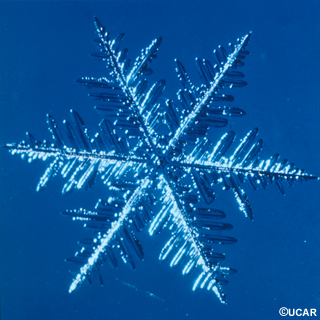
Because snowflakes can vary greatly in size and are often larger than raindrops, the reflectivity difference between ice and water is often reduced. In some cases of extremely large snowflakes, the reflectivity will be higher than in neighboring areas of rainfall.
Also, the water content of the snow will impact the reflectivity value. The more water content the snowflakes have, the higher their reflectivity value. This is especially true of snowflakes that are melting, as they have a very reflective water coating on their edges while still retaining their large diameters.
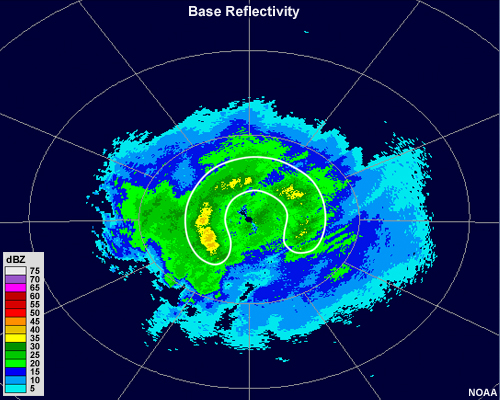
As discussed earlier, this can often produce enhanced reflectivity values at the melting level and appears as a bright band of higher values in an arc or ring around the radar location.
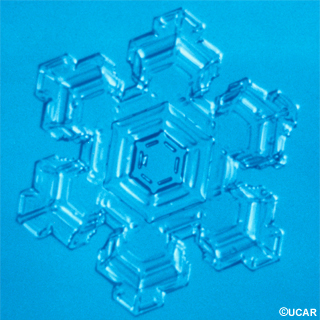
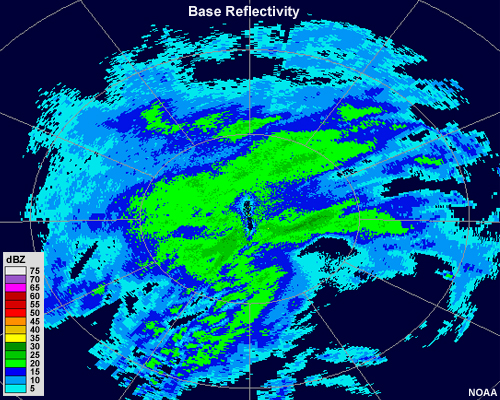
Dry, powdery snow often has quite low reflectivity values, and clear air mode may be used if it is the only precipitation in the area. Here we can see that maximum reflectivity values approach 30 dBZ, but only in a very small area. Most of this region of snow exhibits reflectivity values of 18 dBZ or less, and much of the region has values below 8 dBZ.
In this example, maximum reflectivity values are slightly higher, but the overall pattern is still one that shows the following:
- Gradual changes in reflectivity values
- Grainy texture
- Fuzzy echo edges
These are all characteristic of snow on radar but cannot be used to definitively determine what type of precipitation is occurring. They should be used as guidelines to make an initial assessment and to help determine precipitation type in regions that have few surface observations and/or no soundings available.
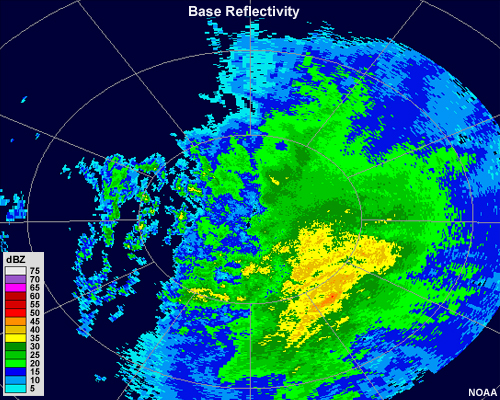
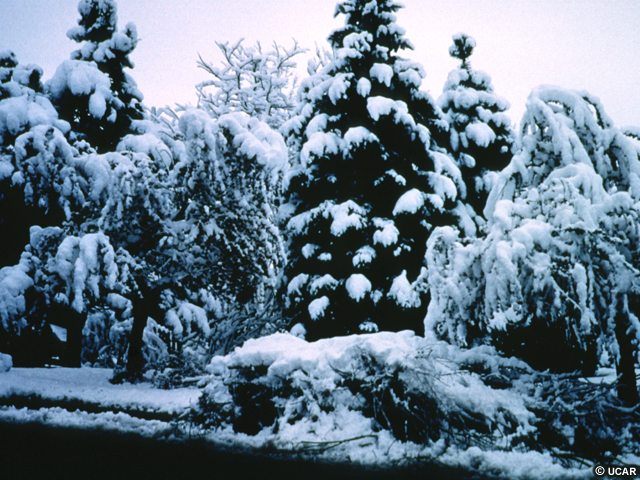
Wet, soggy snow will have much higher reflectivity values. Reflectivity values may even approach 45 dBZ. Snowfall with reflectivity values this high can often be confused for rainfall, but several of the indicators mentioned before are present: weak reflectivity gradients, a grainy texture, and somewhat fuzzy edges to the echo.
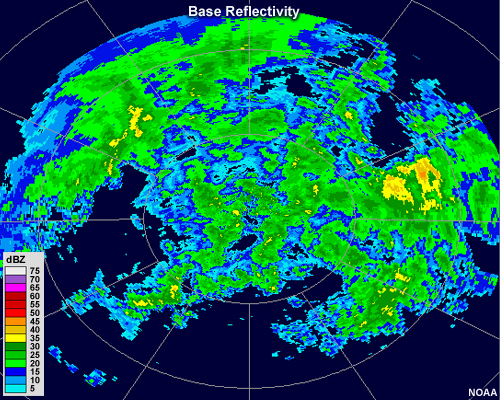
For comparison, a similar raining region of this mid-latitude cyclone looks like this. We can see that while the maximum reflectivity values are about the same as the snowfall loop, the reflectivity gradients are much sharper and the overall structure is more cellular in nature.