Doppler Velocity Measurements » Large-Scale Wind Interpretation
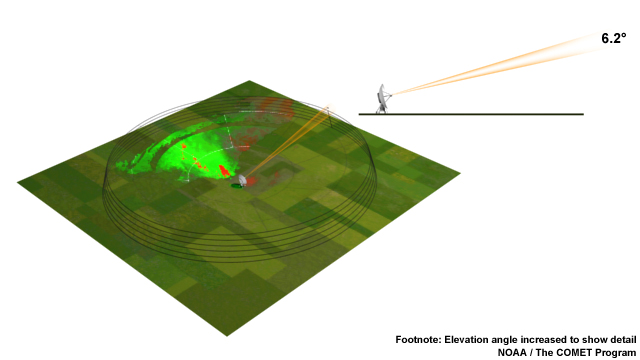
Let's begin with a simple example—interpreting a radial velocity image for a unidirectional wind field. First, remember that a radar pulse moves higher above the earth's surface as it travels from the radar. Thus, targets near the radar represent the low-level wind field, and targets farther away represent winds at higher altitudes.

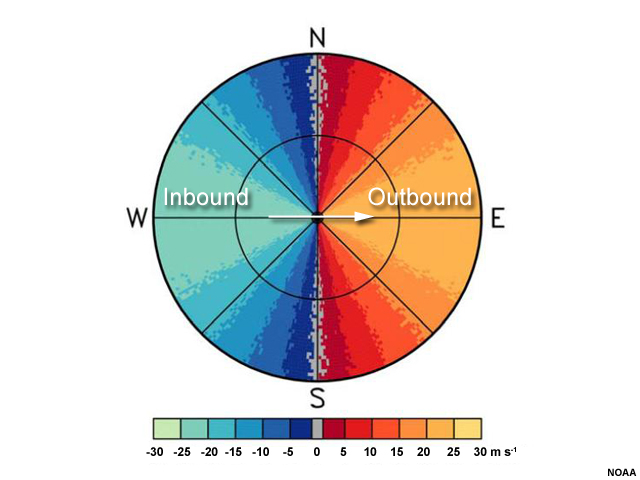
In this idealized base velocity image, winds on the left half are moving toward the radar. We often call these "inbound" winds. Winds on the right half of the image are all "outbound" winds. You can probably guess that the winds must have a westerly component. But is the true wind coming exactly from the west? How fast is it blowing at the surface? What about at higher heights?
To determine the direction of the wind at the location of the radar, we simply need to find the closest measurement of the maximum inbound and maximum outbound radial velocities and connect them with a line.
To determine the wind speed and direction at a certain height away from the radar, we use the zero isodop.
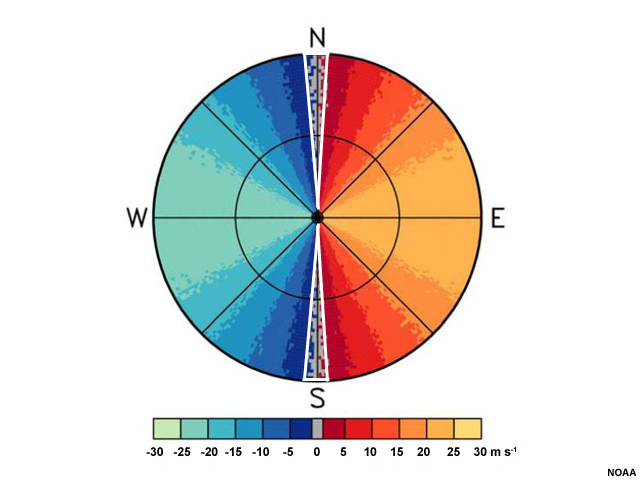
An isodop is a line of constant Doppler velocity. The zero isodop is particularly useful because we know that the wind is perpendicular to the radar beam at any point along it. It could also mean that targets are stationary, but this is unlikely considering the fast winds we see near it.
We begin by drawing an arrow from the radar's location to where the zero isodop intersects the specific height (i.e., the range) one wants to examine. In this case, let's figure out the wind direction at the first range ring from the radar. We draw an arrow from the radar location to where the zero isodop meets the range marker.
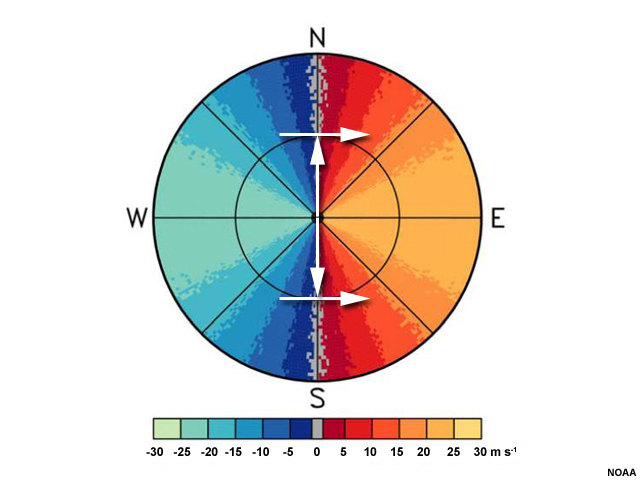
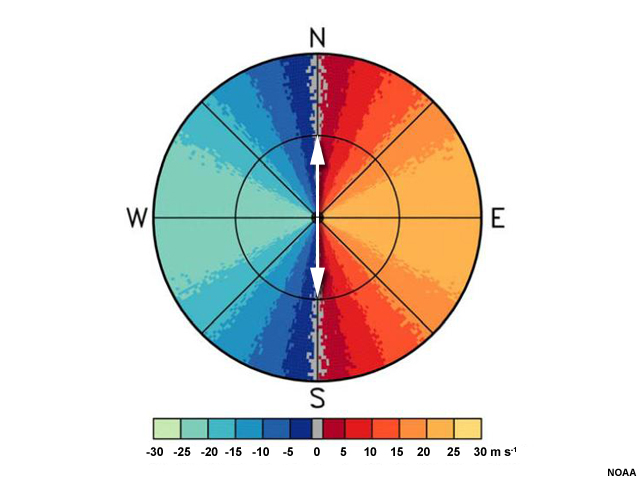
Next, we draw an arrow perpendicular to the first arrow we made, pointing from the inbound velocities toward the outbound ones. This will tell us the direction of the wind at that location.
What is the maximum wind speed here? The easiest way to estimate the wind speed at a location is to find the maximum and minimum values that are anywhere along that same range ring from the radar.

In this case, we can see that there is a radial velocity maximum between 20 and 25 m s-1 and a minimum on the other side of -20 to -25 m s-1. Inherent in this method is an assumption that the winds are blowing about the same speed everywhere at a particular height.
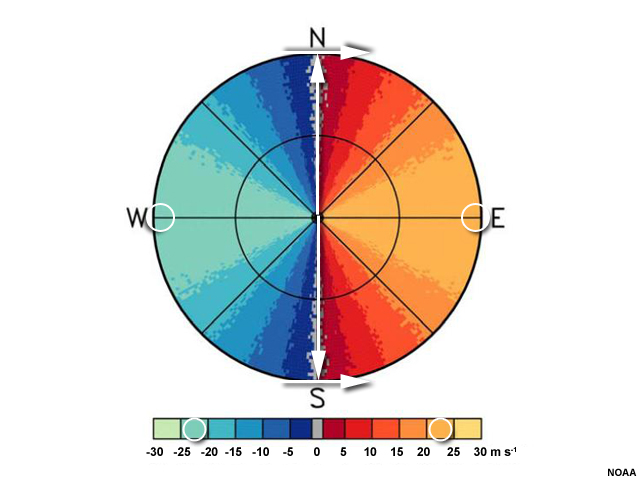
We can perform both of these processes again to estimate the wind speed and direction at the edge of the radar's range. We draw a line from the radar location to where the zero isodop meets that range. Then, we draw our perpendicular arrow that represents the wind direction—once again, in this case, the direction is from the west. The wind speed can again be found by looking along that range for the maximum and minimum values. The maximum and minimum are again between 20 and 25 m s-1.
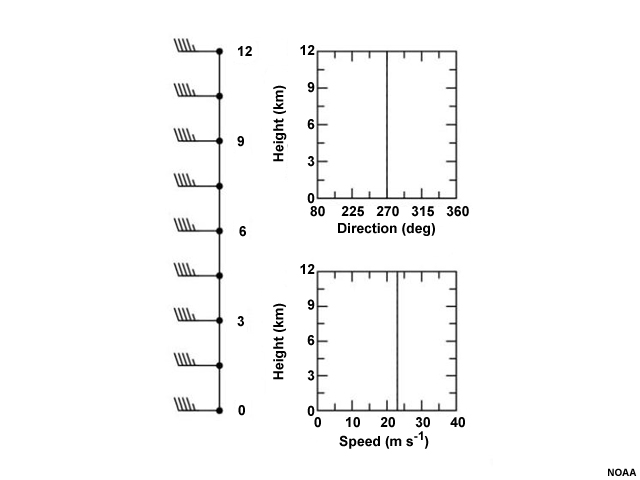
The winds in this example are westerly and the same magnitude everywhere. A sounding taken near a radar showing these radial velocities would have winds that look something like this.